VIZOLOGY 101
Navigation Tips
Navigation Tips
PICTOGRAPH
STEP 1
Read the title to get an idea of what the infographic is about. Then find the list of sources to see where the data come from.
The two sources for this infographic are educational websites— one hosted by National Geographic and the other by a company that sells honey.
Which of these statements is true?
A Companies that sells products are always biased
B Companies always give accurate information
C Companies should fact-check information on their educational websites
STEP 2
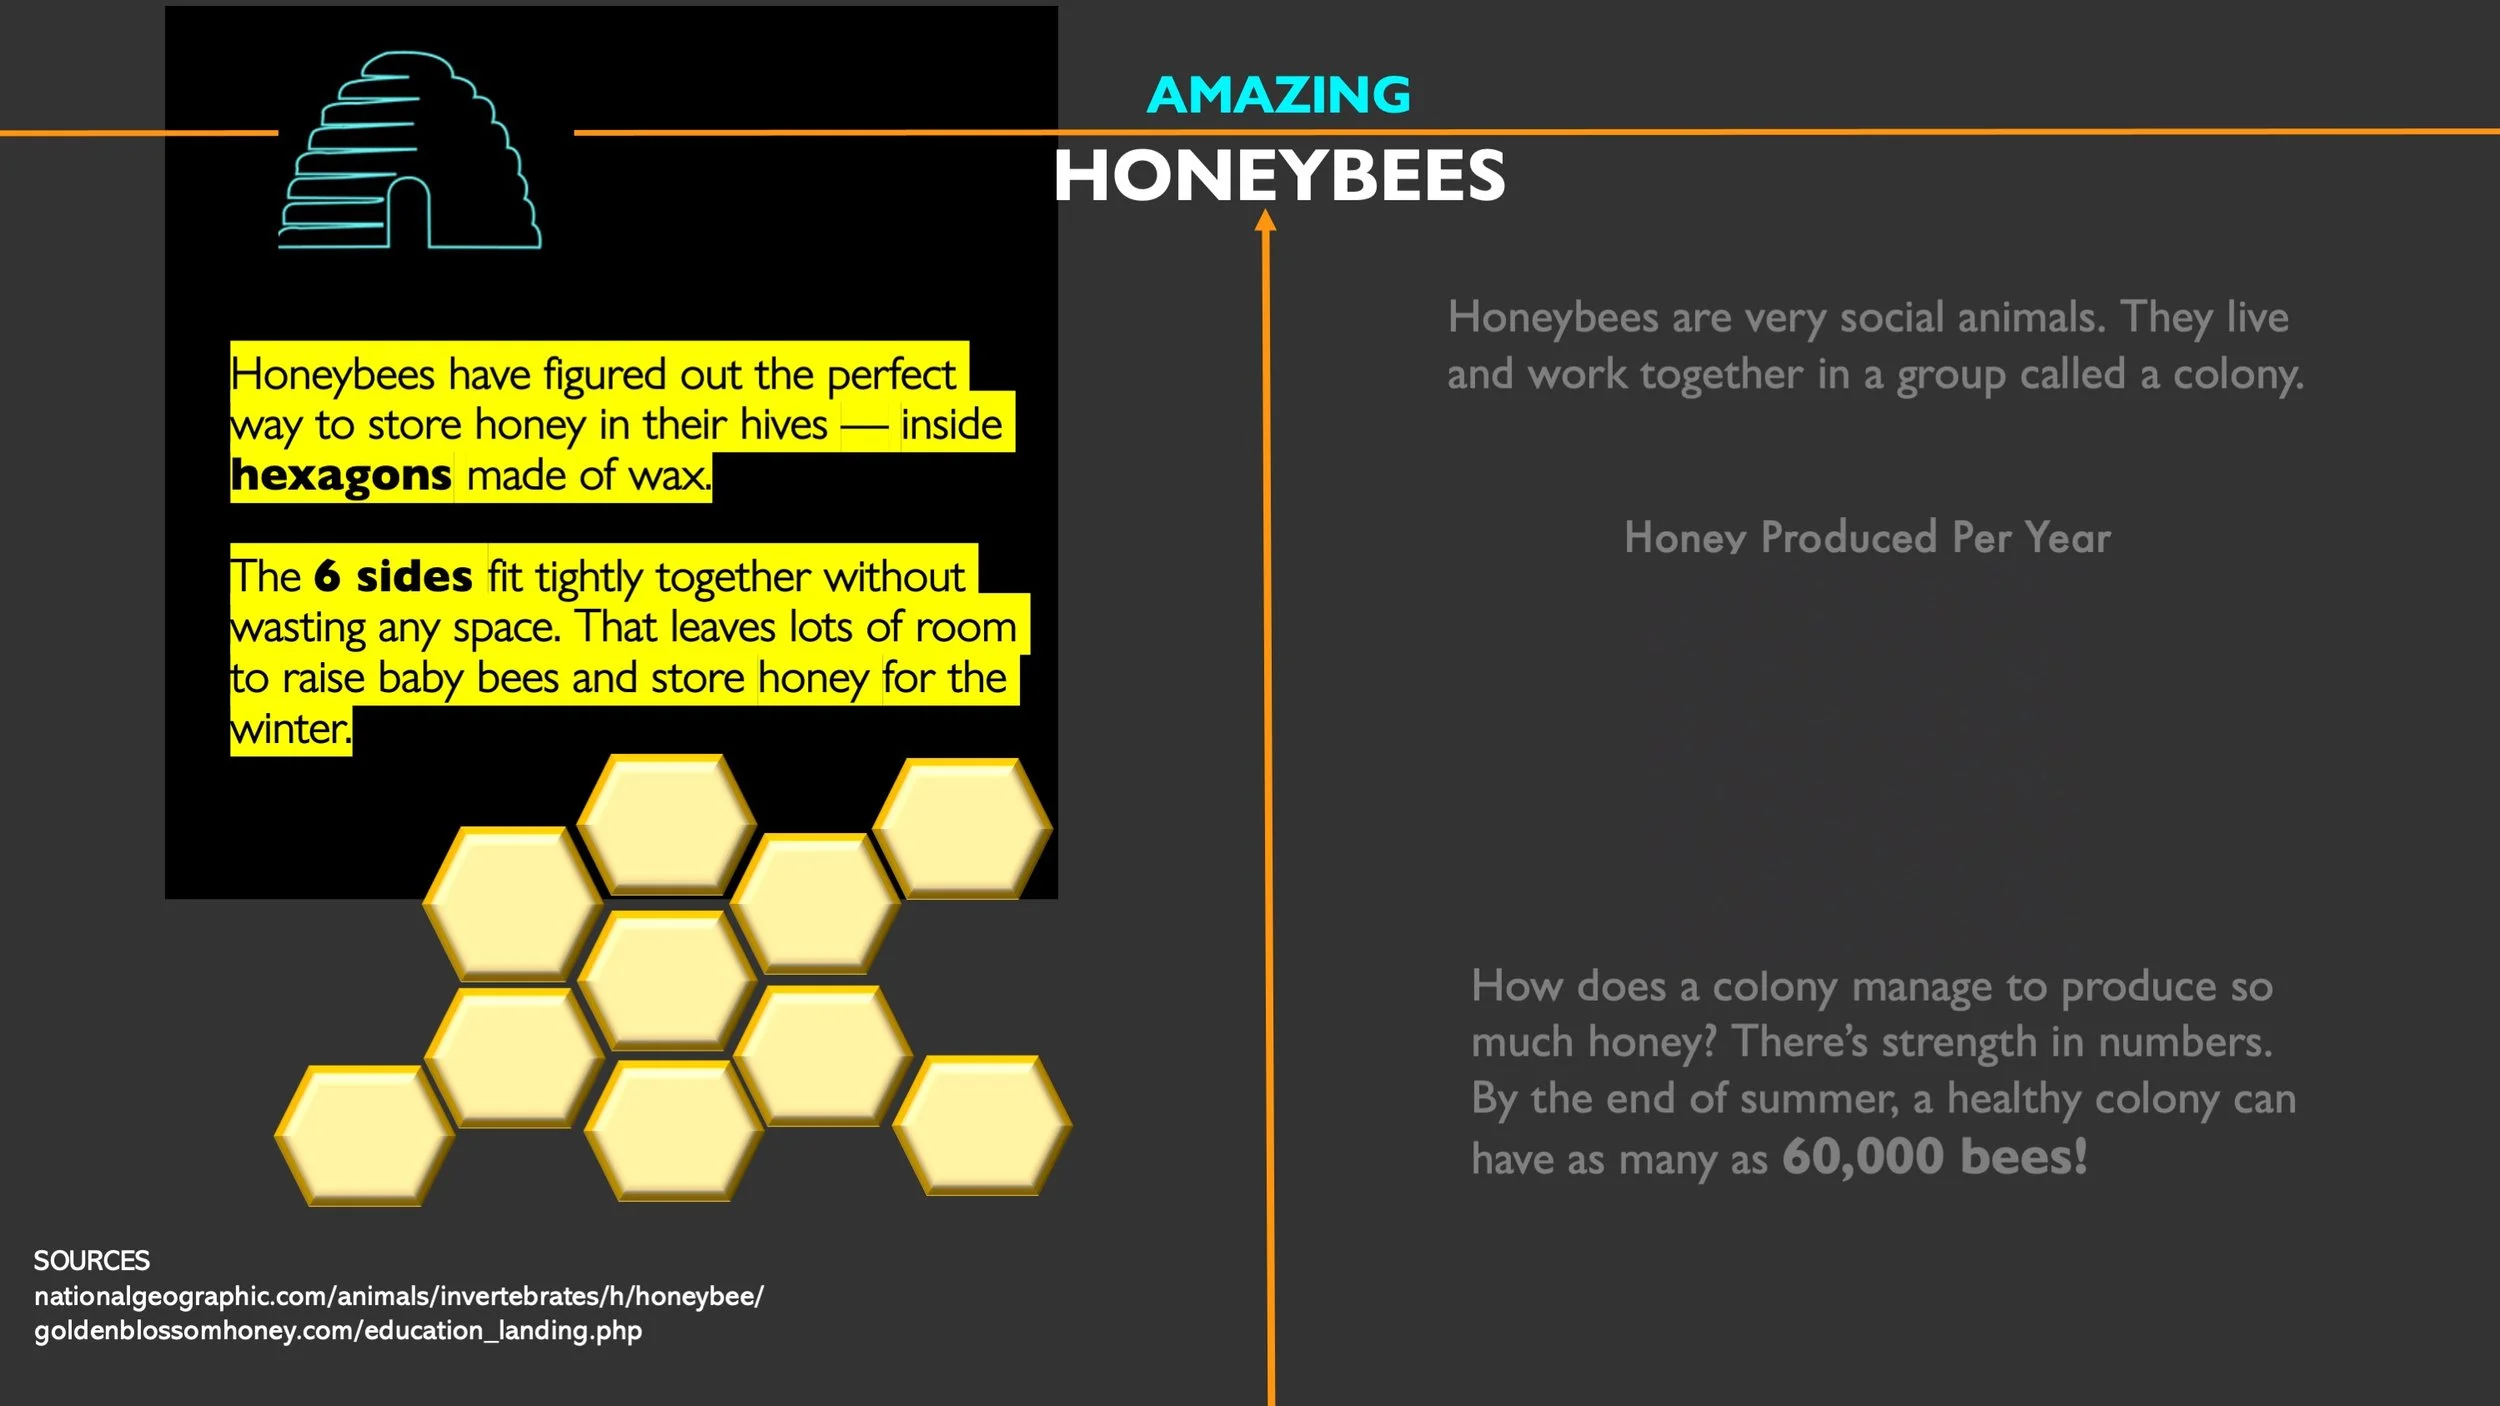
Look at the design to see how it organizes information and decide where you’ll start reading.
This infographic is divided into two sections. Start on the left side and read about how honeybees use hexagons. As you’re reading, focus on words and numbers in big, bold, or colorful type. That will help you remember what you read.
TAKE A CLOSER LOOK
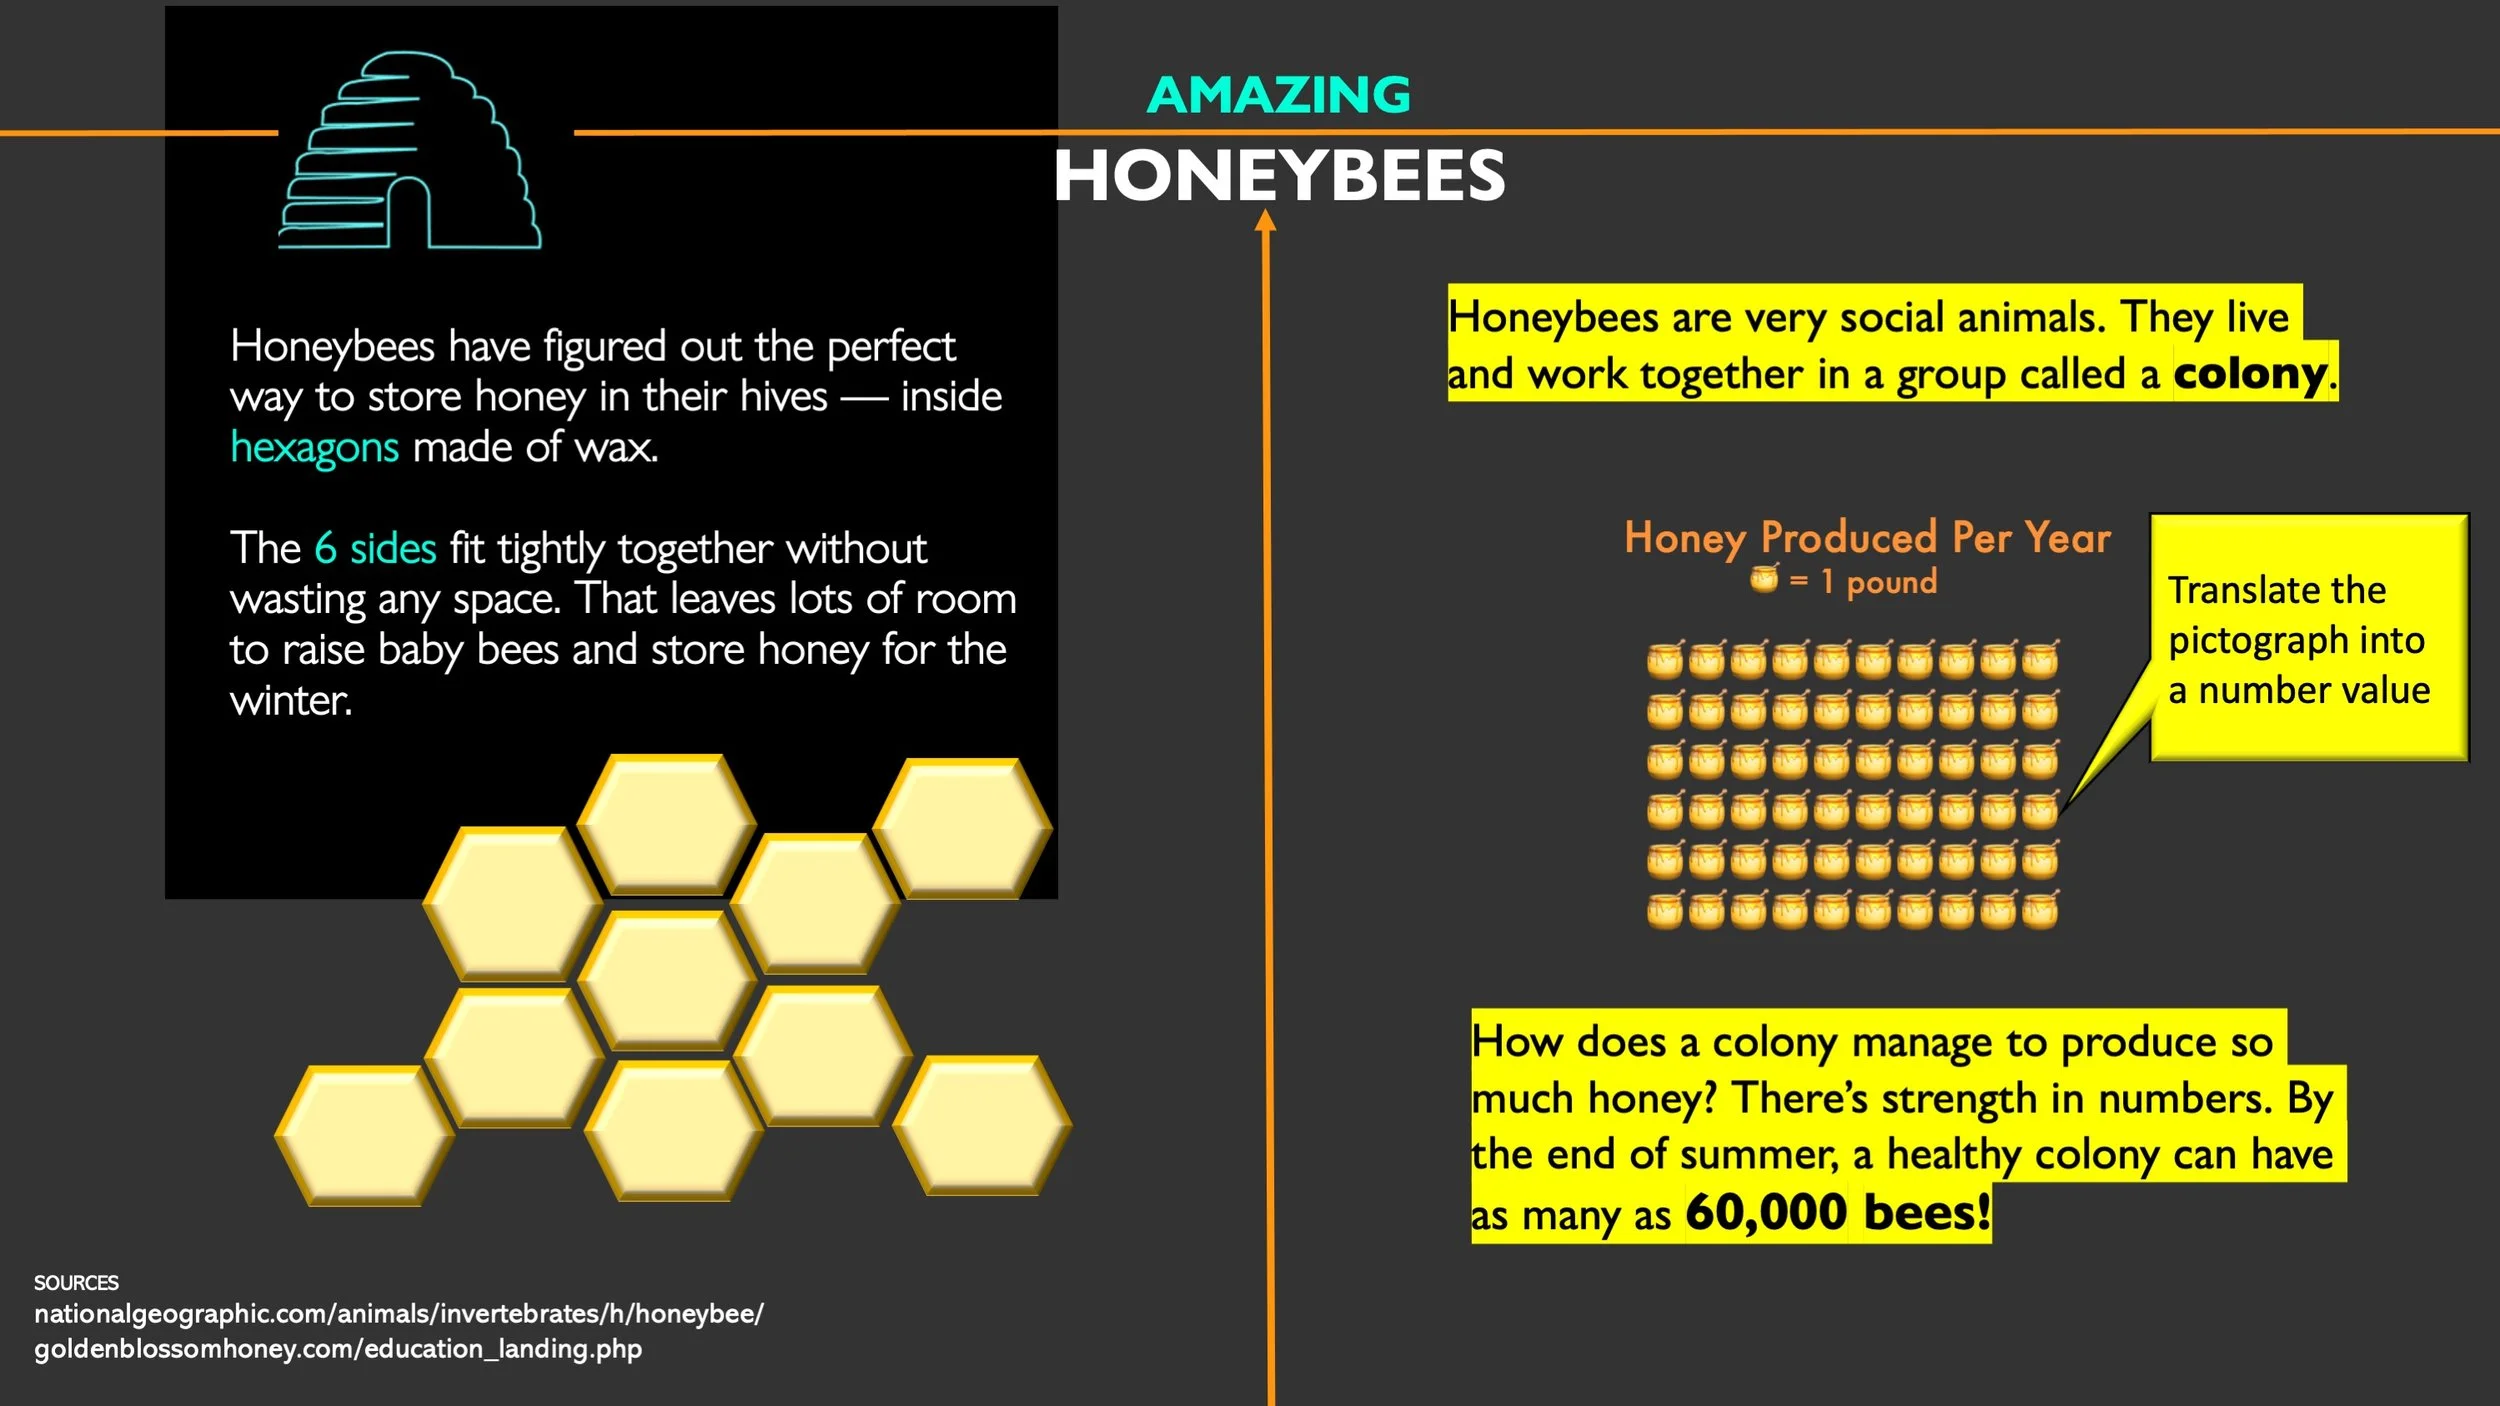
Read the next section. When you come to the pictograph, read the title and the key. The key is the note that explains how much each honeypot represents: 1 pound.
Use the icon array to calculate the total number of pounds a colony produces each year. Since each row has an equal number, you can count the number in the first row and then
Add the rows. 10 + 10 + 10 + 10 + 10 + 10.
Or, multiply by the number of rows. 10 x 6.
Which method works for you?