VizTreks is a new learning tool
powered by user-driven inquiry
The adventure begins as soon as you log on and select a topic to explore.
Trees Module

Topic Intro

Colorful Infographic
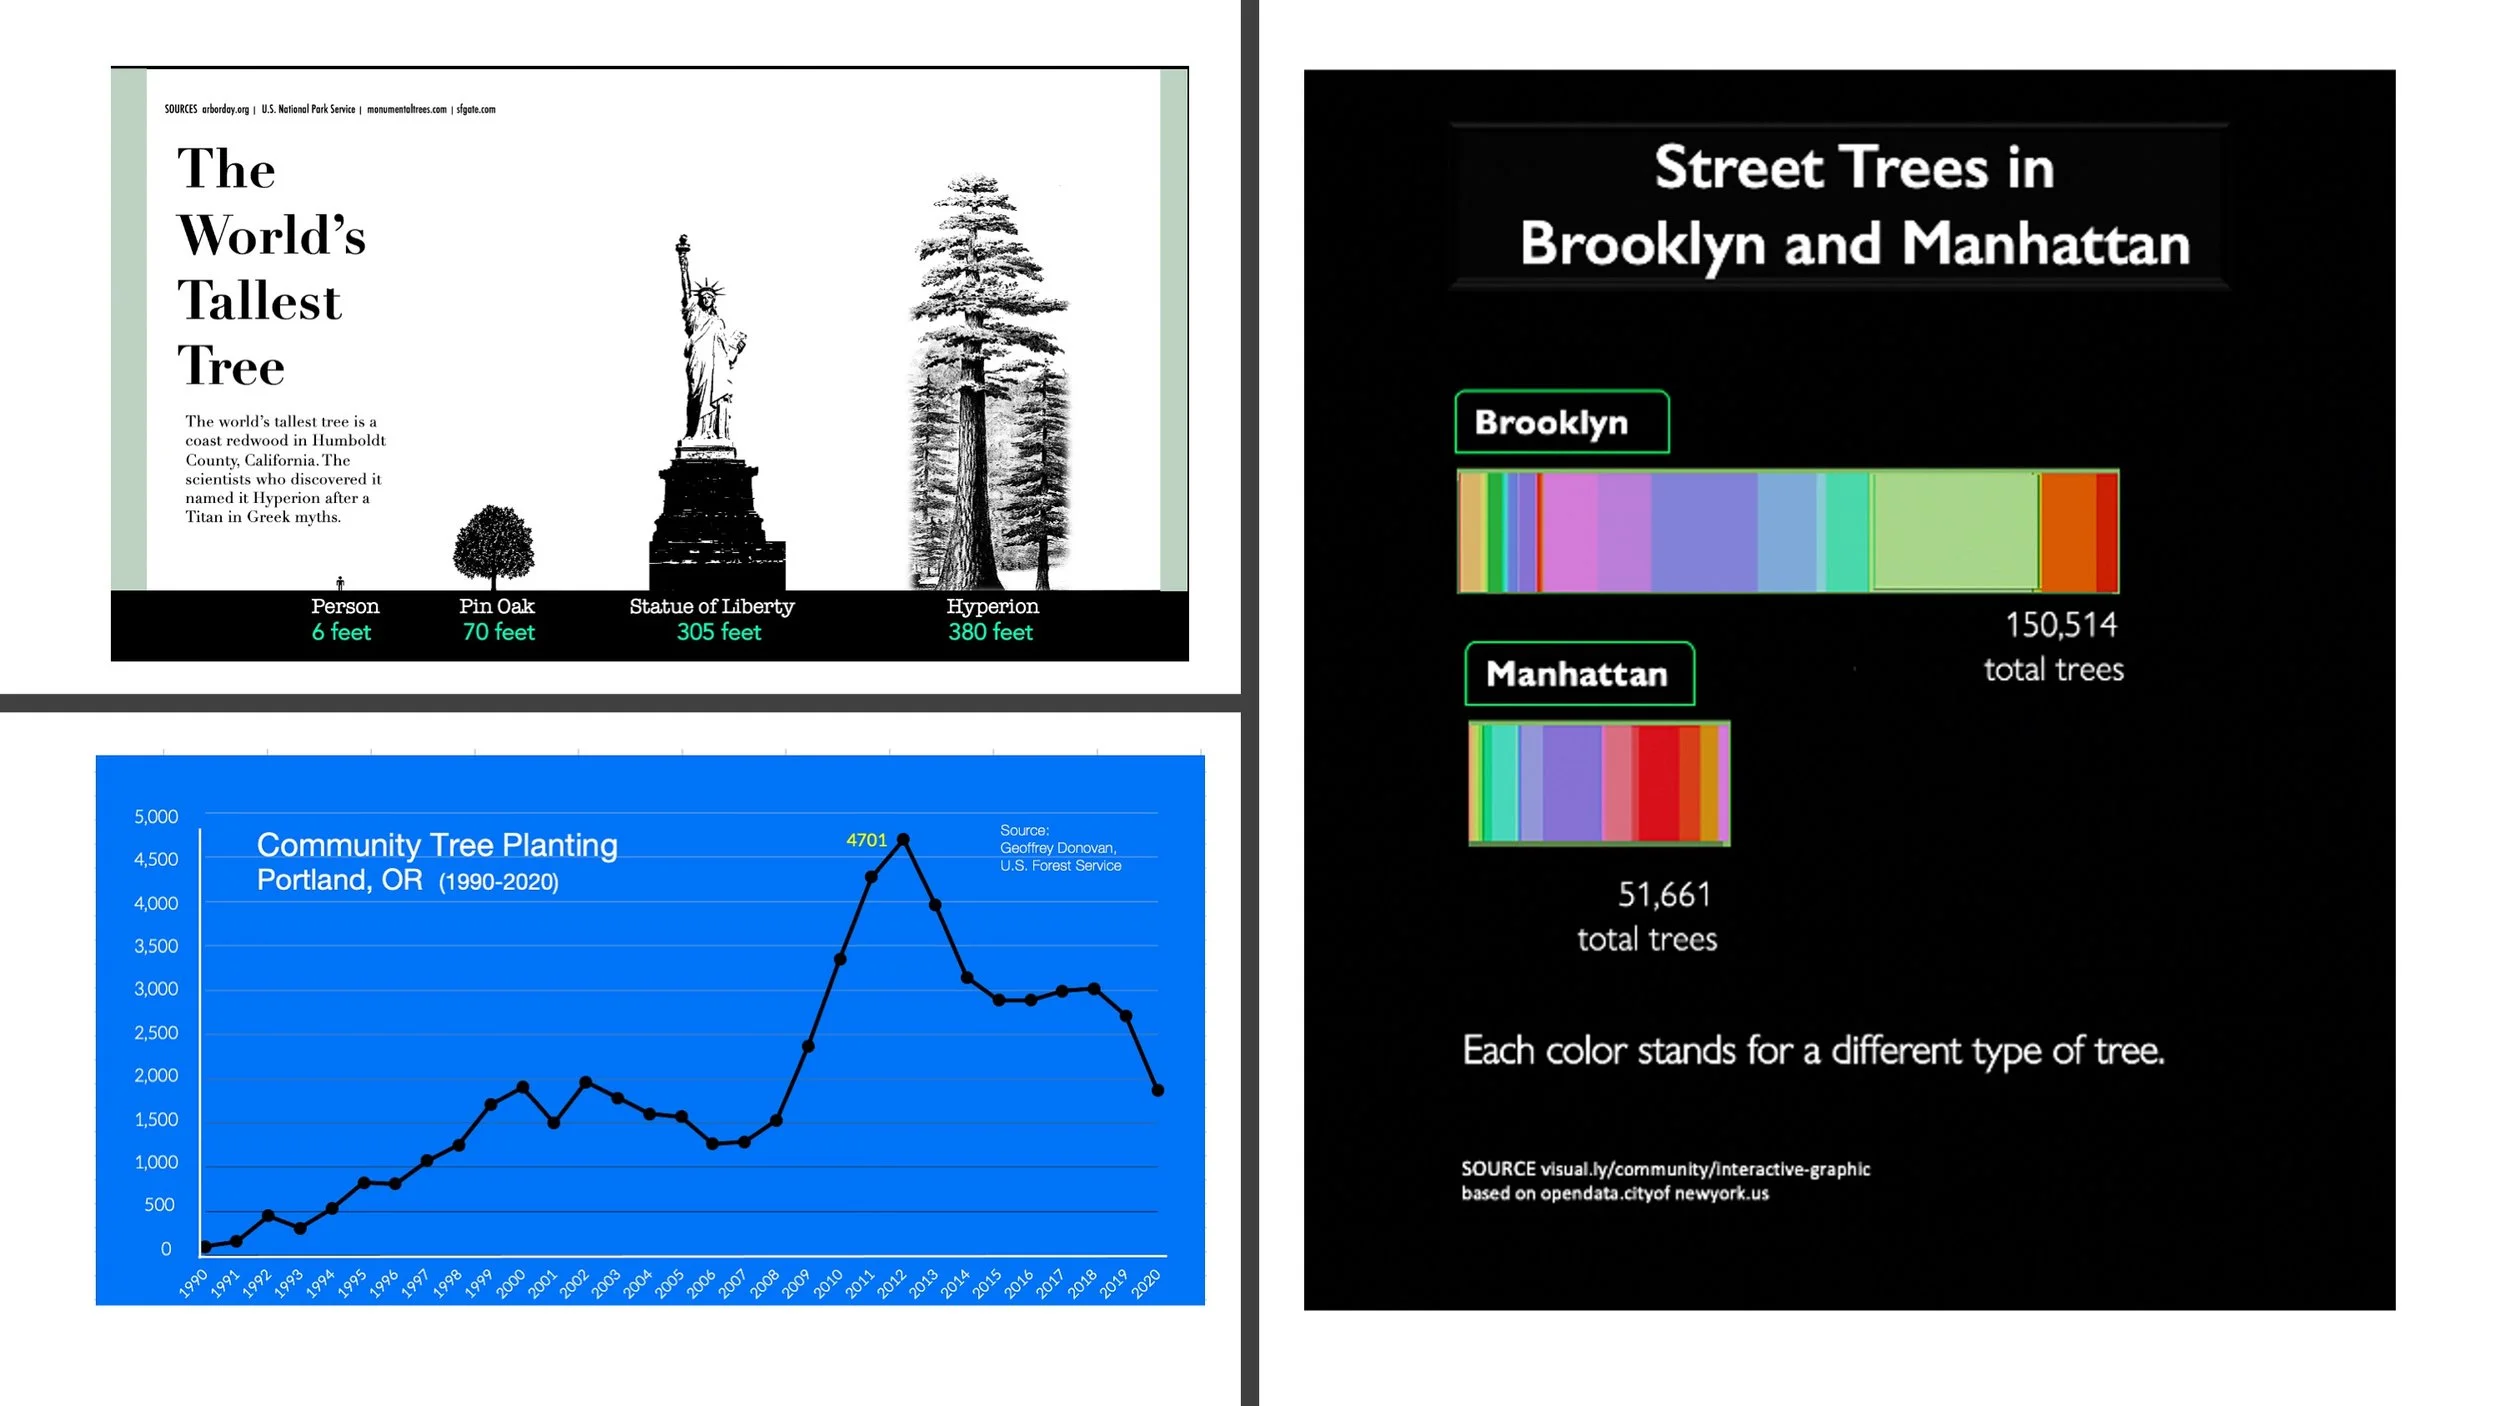
3 Data Visualizations
Each module features
A topic intro to build background and spark interest
Strategies for reading, remembering, and responding to a colorful infographic
Multimodal instruction that teaches users how to read, interpret, and critically evaluate three data visualizations. As you move through the module, you’re introduced to increasingly challenging math concepts and graphic formats.
Embedded support with on-demand supporting text, text-to-speech, and illustrated glossary
All site content is registered with the U.S. Copyright Office, effective November 2023


