Glossary
P to Z
🚧 UNDER CONSTRUCTION When users encounter an unfamiliar word, they have access to on-demand audio and text support—a pop-up window with the glossary entry.
parallelogram
A closed shape with four sides and opposite sides that are parallel. Rectangles, squares, and rhomboids are parallelograms.


table
A group of facts and figures arranged in columns and rows.
trend
Change in a data set over time.
per capita
For each person
ranked list
Numbered list that shows how things rate based on their performance or popularity
pictorial chart
A visual representation of data that uses pictures to compare heights or sizes.
raw data
Data gathered from a source before being organized, sorted, analyzed or visualized.
rectangle
A closed shape with four sides and four right angles. Unlike a square, only the opposite sides of a rectangle are the same length.
rhomboid
A four-sided figure with opposite sides that are parallel and no square corners. A rhomboid looks like lopsided diamond.
rank
(noun) The rating, or position assigned to someone or something in a category
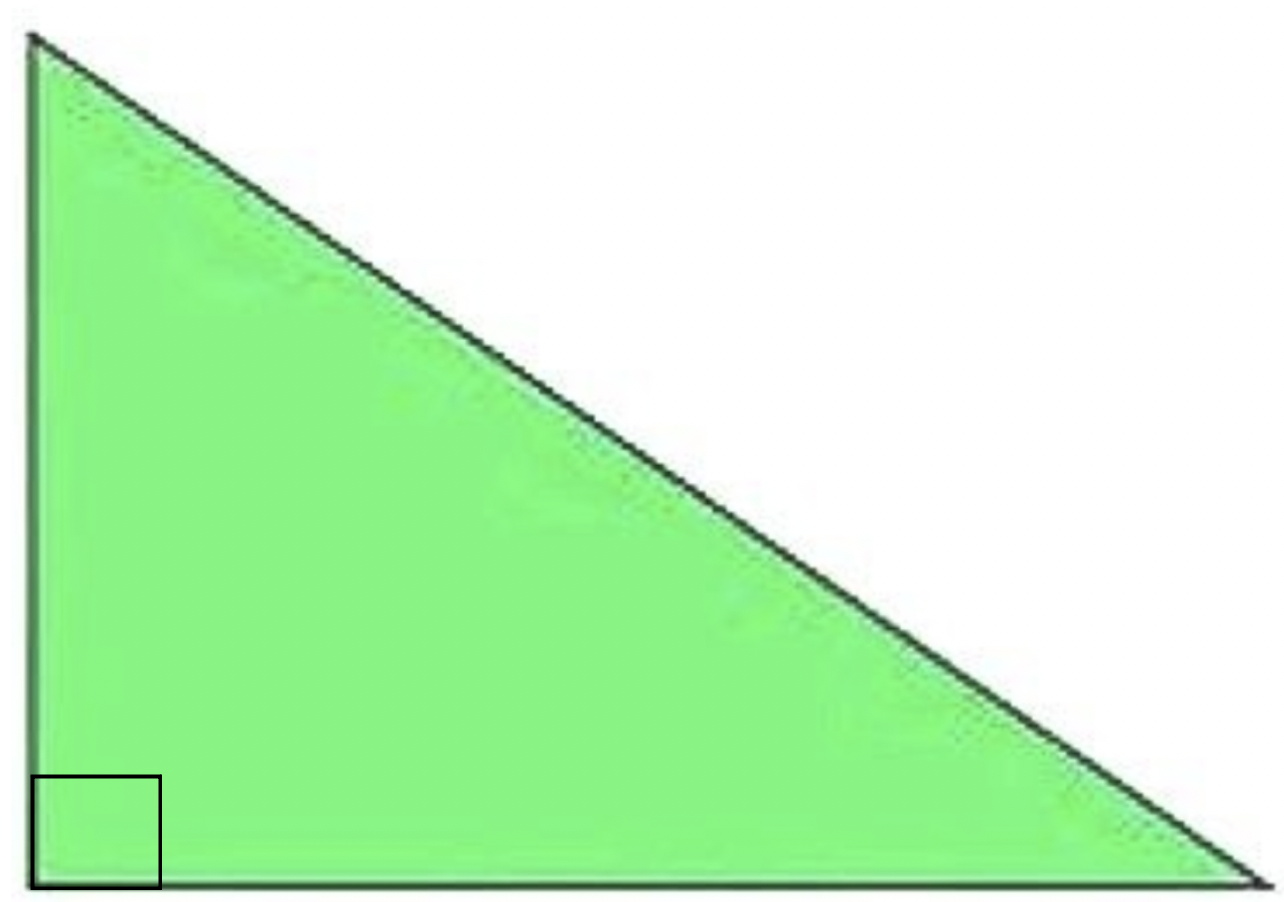
right triangle
A triangle with one right angle that forms a square corner
sample
A part of a population used to represent the whole population in a survey.
roots
Parts of a plant or tree that grow underground and carry water and nutrients from the soil up to the stem
Place or culture where someone or something comes from
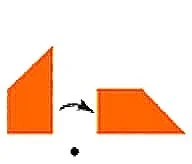
rotate
When you rotate a shape, you turn it around a central point.
skip count
To count by adding a number other than 1. When you skip count by 5 you count 0, 5, 10, 15, and so on.
scale
Units of measurement used in a graph, with regular spaces in between. The line graph uses a two-pound scale.
In a map, model, or drawing, the relationship between the size of something pictured and its size in the real world. In this map, the scale is one inch equals 100 miles.
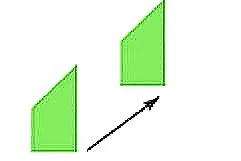
slide
When you slide a shape, you
move it up, down, or sideways in a straight line.
stacked bar graph
A bar graph divided into segments
species
A group of animals or plants that are alike in some ways and able to mate and have offspring
square
A closed shape with four equal sides and four right angles
survey
(noun) Collection of data based on asking a group of people the same question(s). More than 200 sixth graders completed the survey about school lunches.
treemap
A way to show how categories compare using the size of nested rectangles.

thousand
A thousand is ten hundreds. It is written as 1 followed by three zeroes: 1,000. You may not realize it but you blink your eyes about one thousand times every hour!
understory
The plant life that grows between the forest floor and the tree canopy. Very little light reaches the understory of the forest.
x-axis
The line on a graph that runs horizontally (left to right). In bar graphs, category labels are often shown on the x-axis.
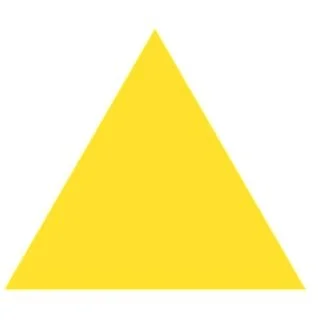
triangle
A closed shape with three straight sides and three corners. See also right triangle.
tropics
Areas near Earth’s equator that are warm and rainy

whole number
A positive number including 0 that is not a fraction. Whole numbers are 0, 1, 2, 3, 4, and so on.
zero baseline
The point in a chart where the axis starts at 0. For accurate and easy comparisons, a bar graph must use a zero baseline.
vertical
(adjective) standing or pointing straight up
y-axis
The line on a graph that runs vertically (top to bottom).