VIZOLOGY 101
Navigation Tips
Navigation Tips
TREEMAP
STEP 1
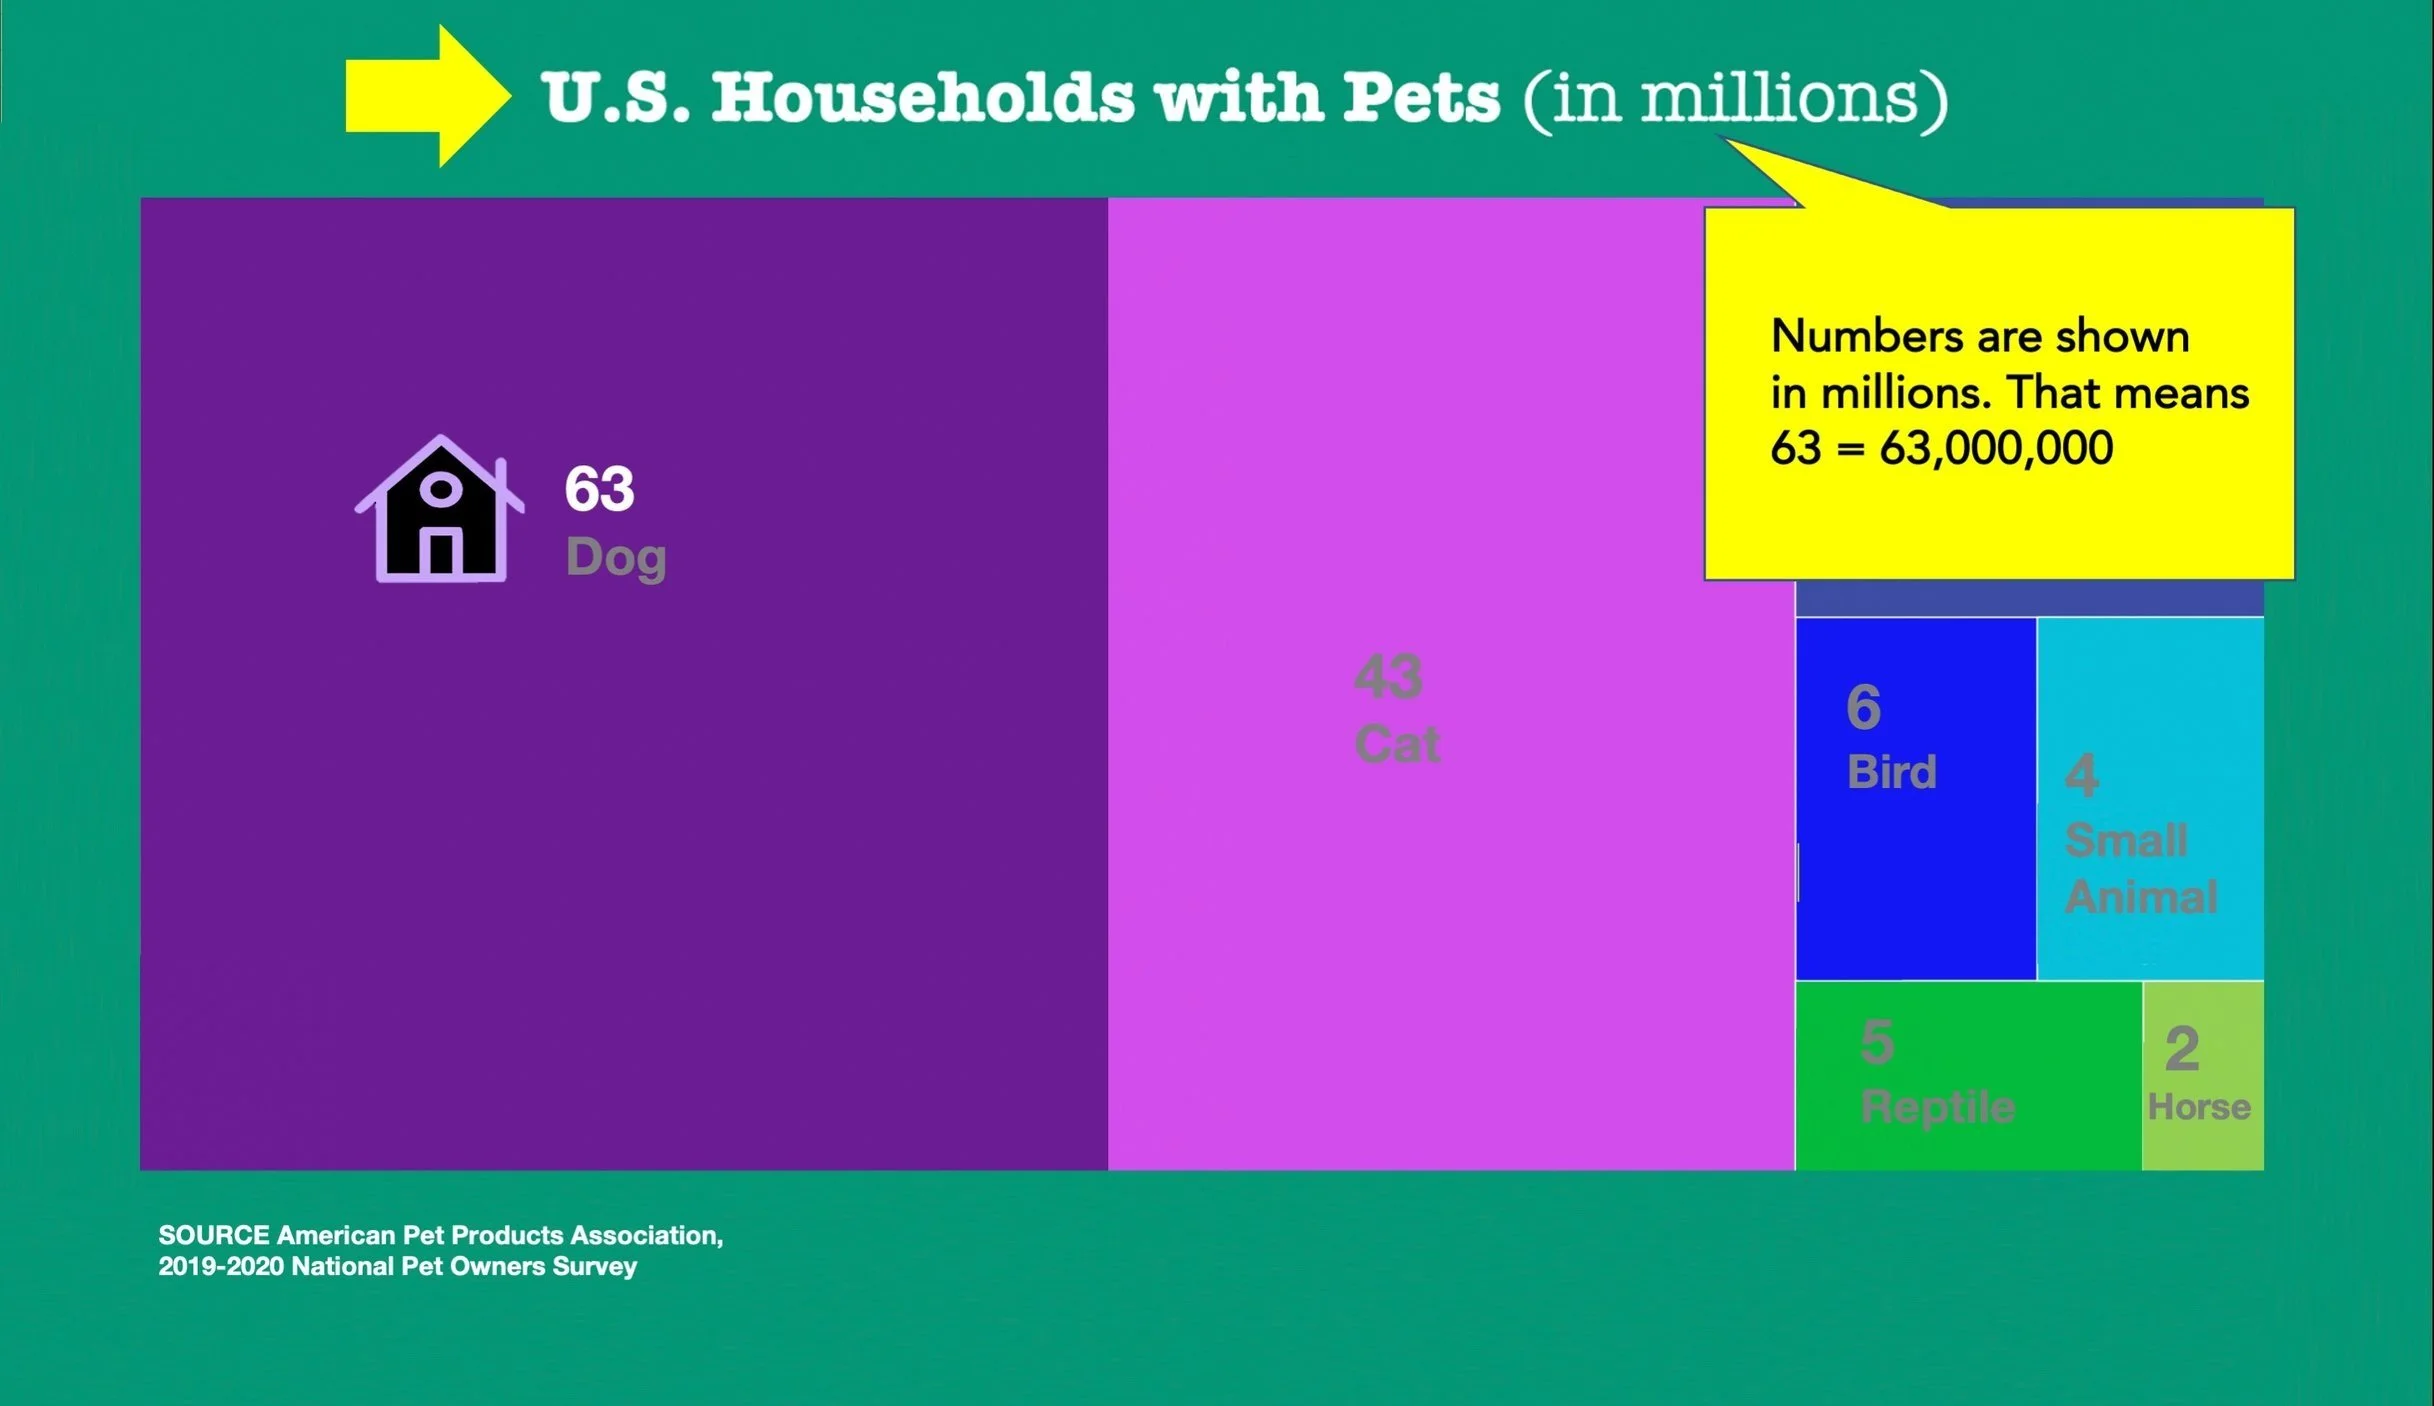
Read the title closely to get an idea of what the treemap is about. There can be a lot to unpack even in a short title. This treemap compares the number of households in the United States that have certain types of pets.
Look for measurement notes. The numbers displayed in this treemap represent millions.
STEP 2
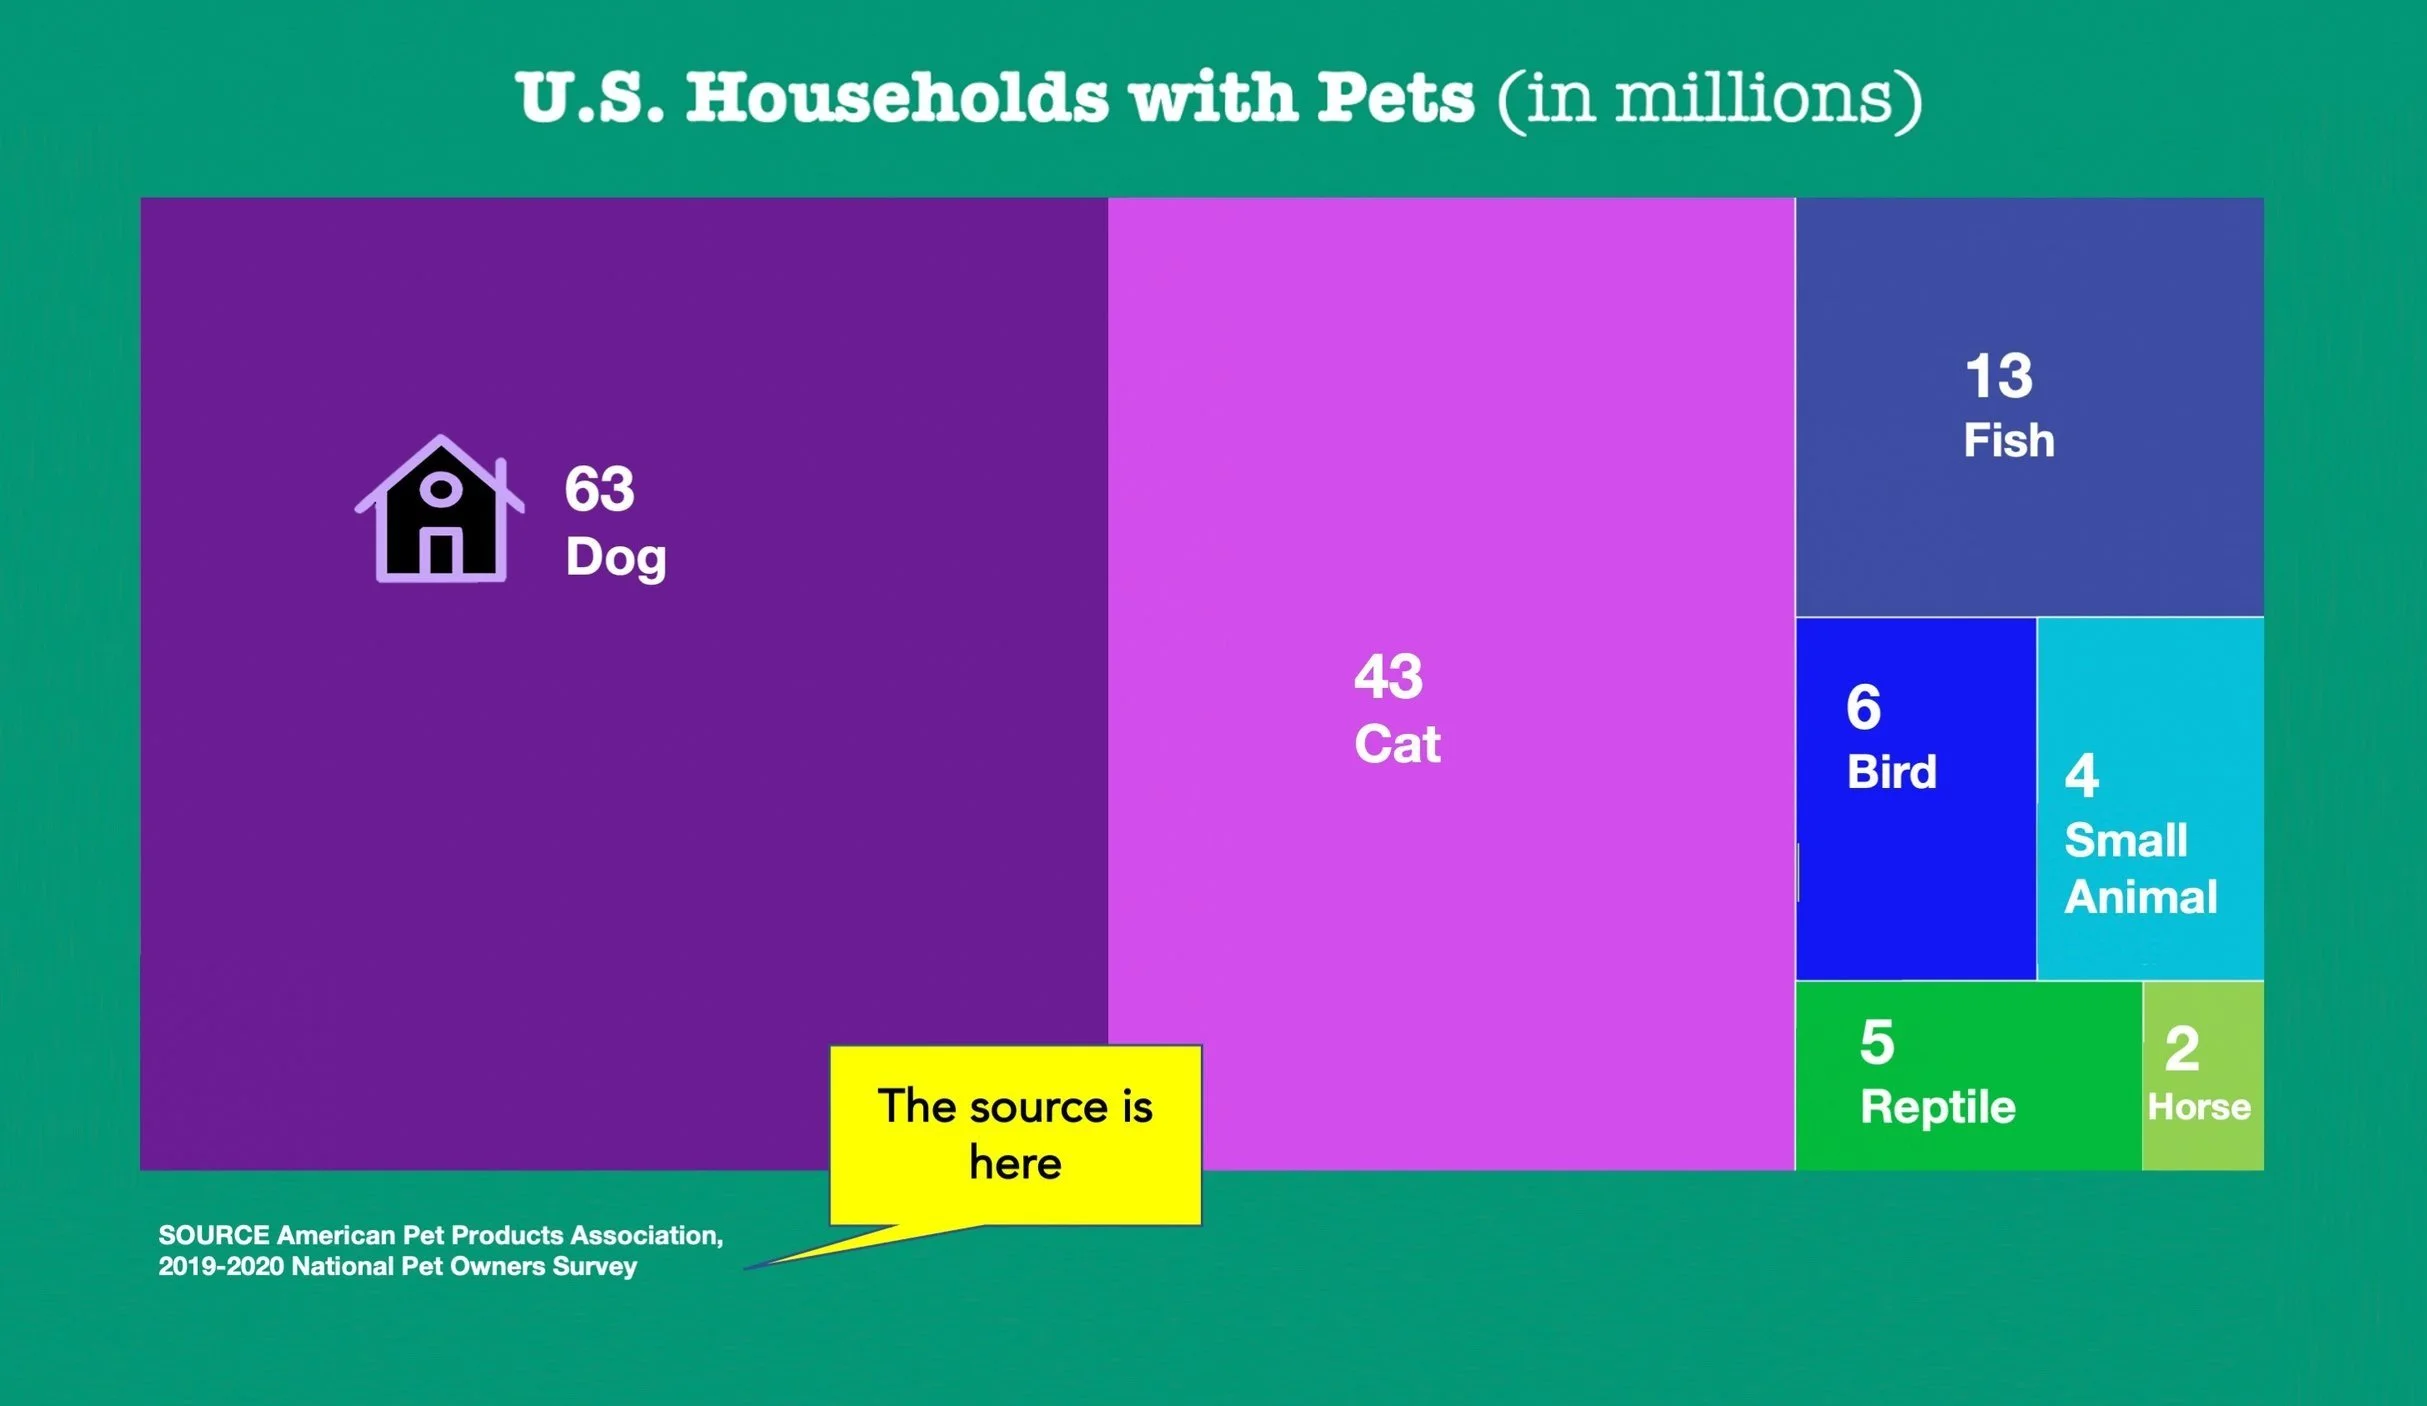
Find the source.
More than 9,000 people who buy pet products took part in the survey. What’s the best way for the survey takers to make sure the data are accurate?
A collect data from people at a dog show
B focus on one region of the country
C include data from different age groups
STEP 3
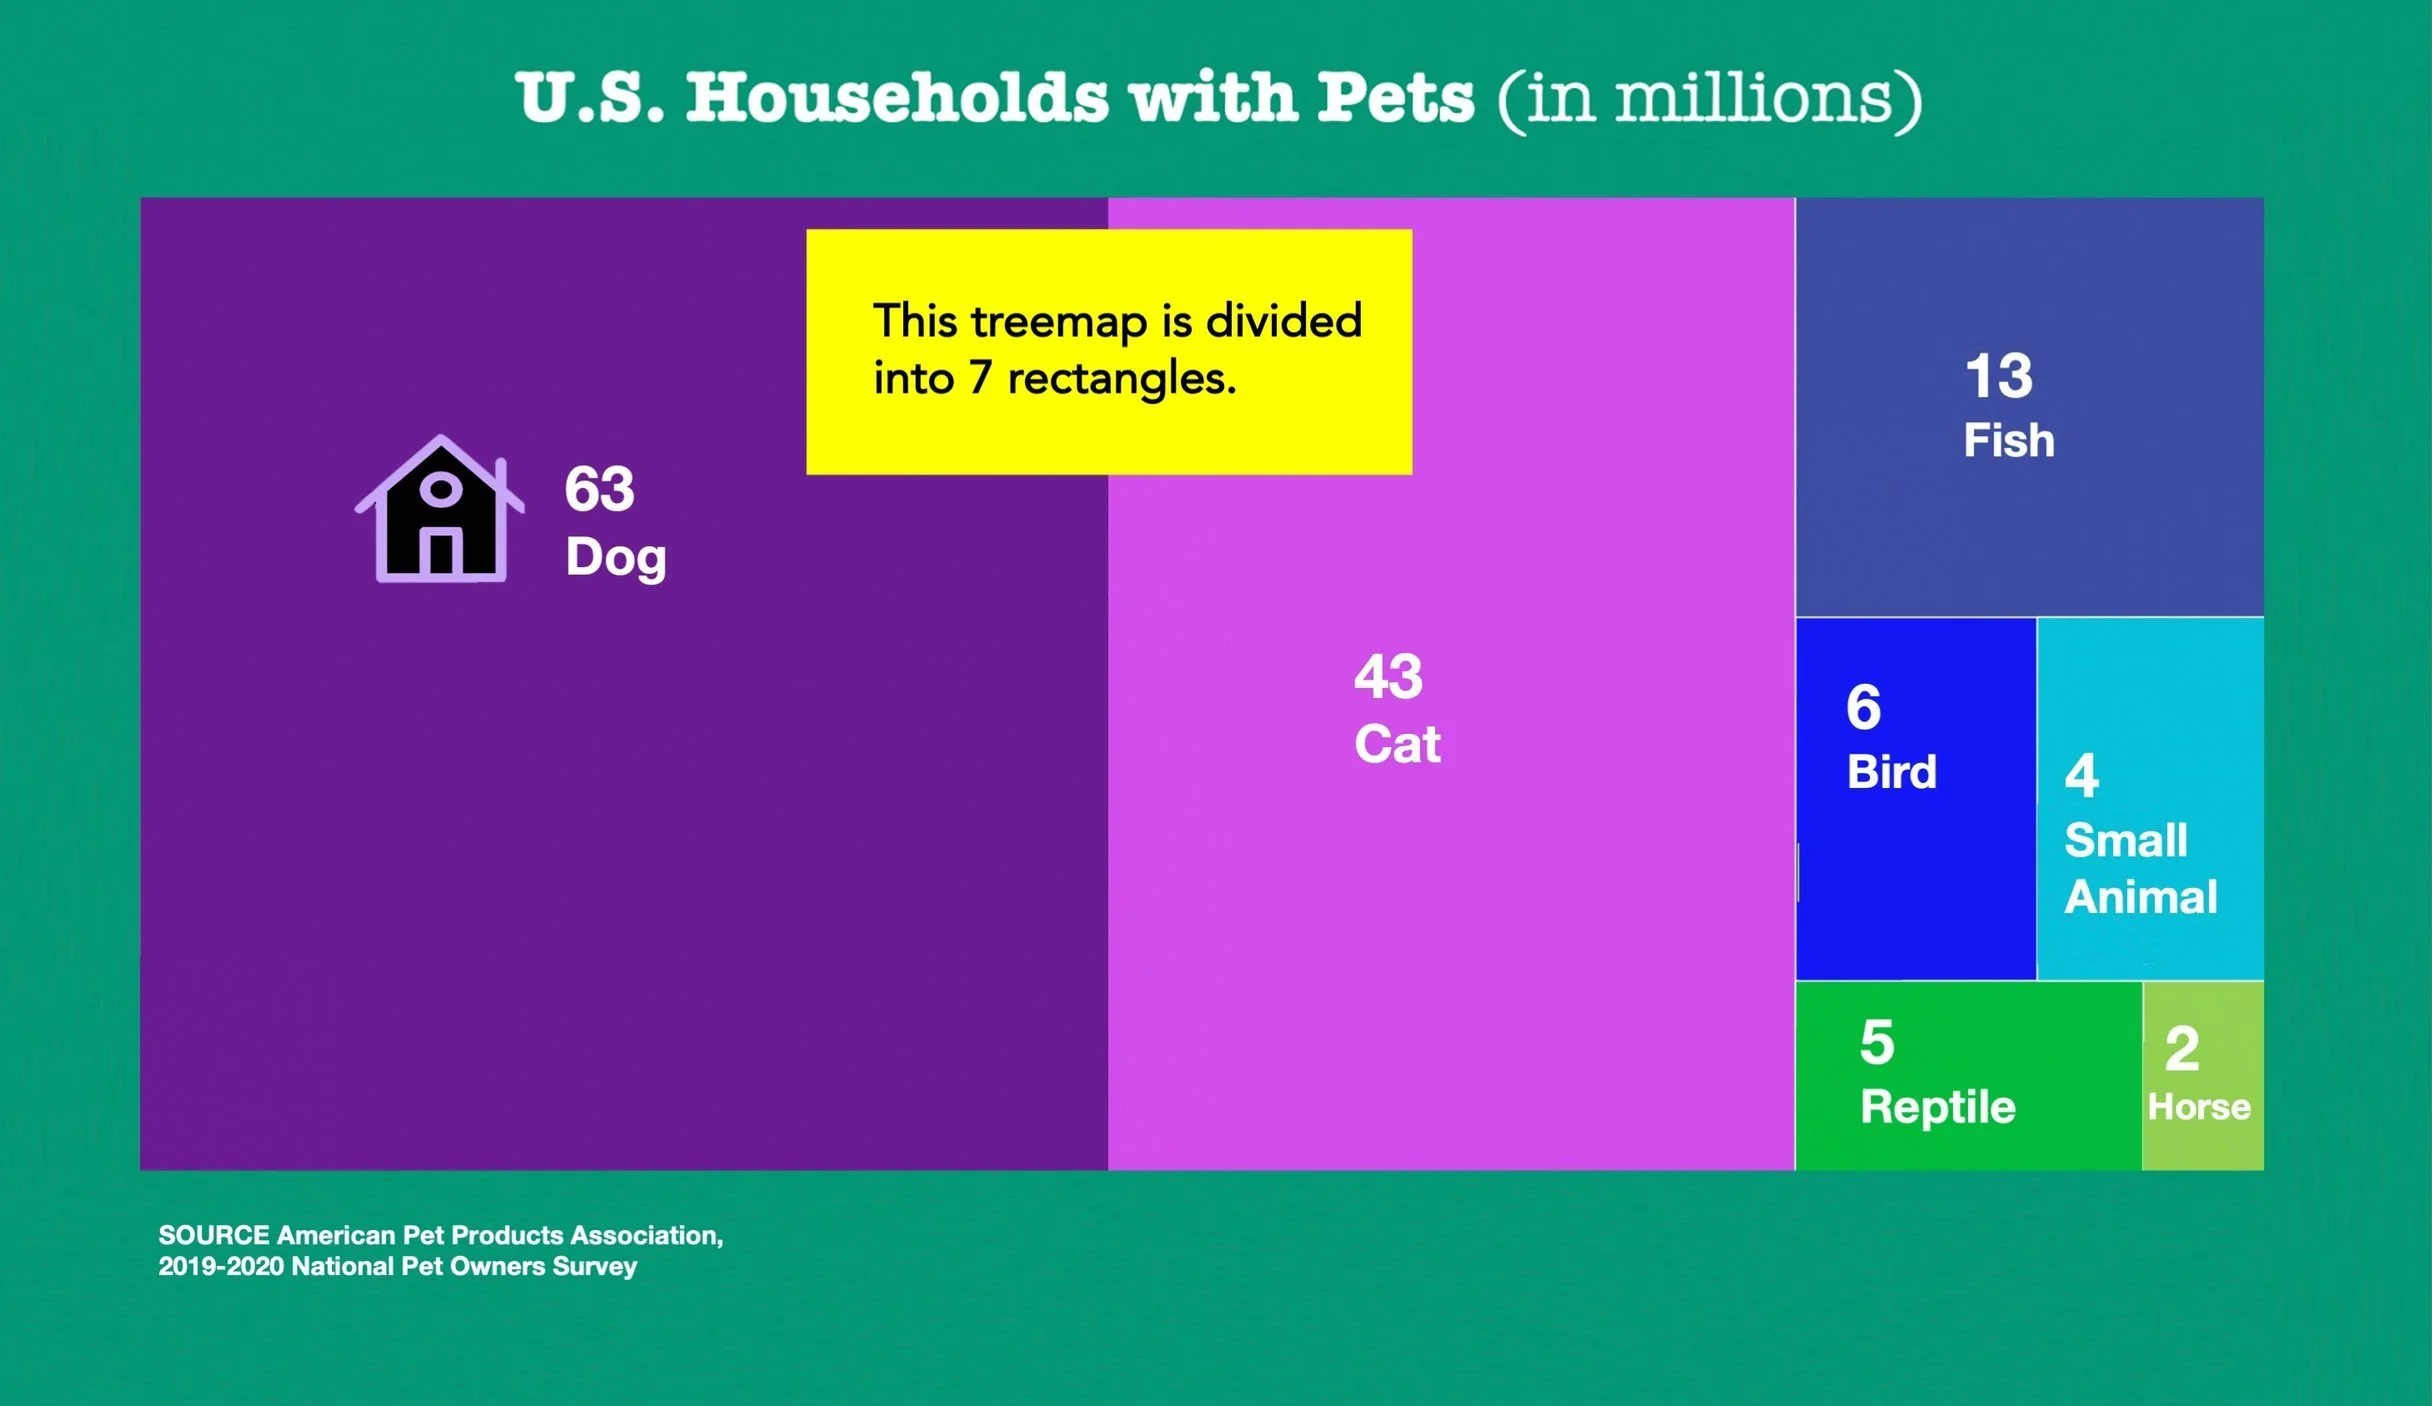
Notice how it is organized. This treemap is divided into seven rectangles. The largest ones are on the left, arranged in order of decreasing size toward the bottom right.
Read the labels. Inside each rectangle are two labels: one indicates a group that owns a certain pet. The other is a number value measured in millions.
TAKE A CLOSER LOOK
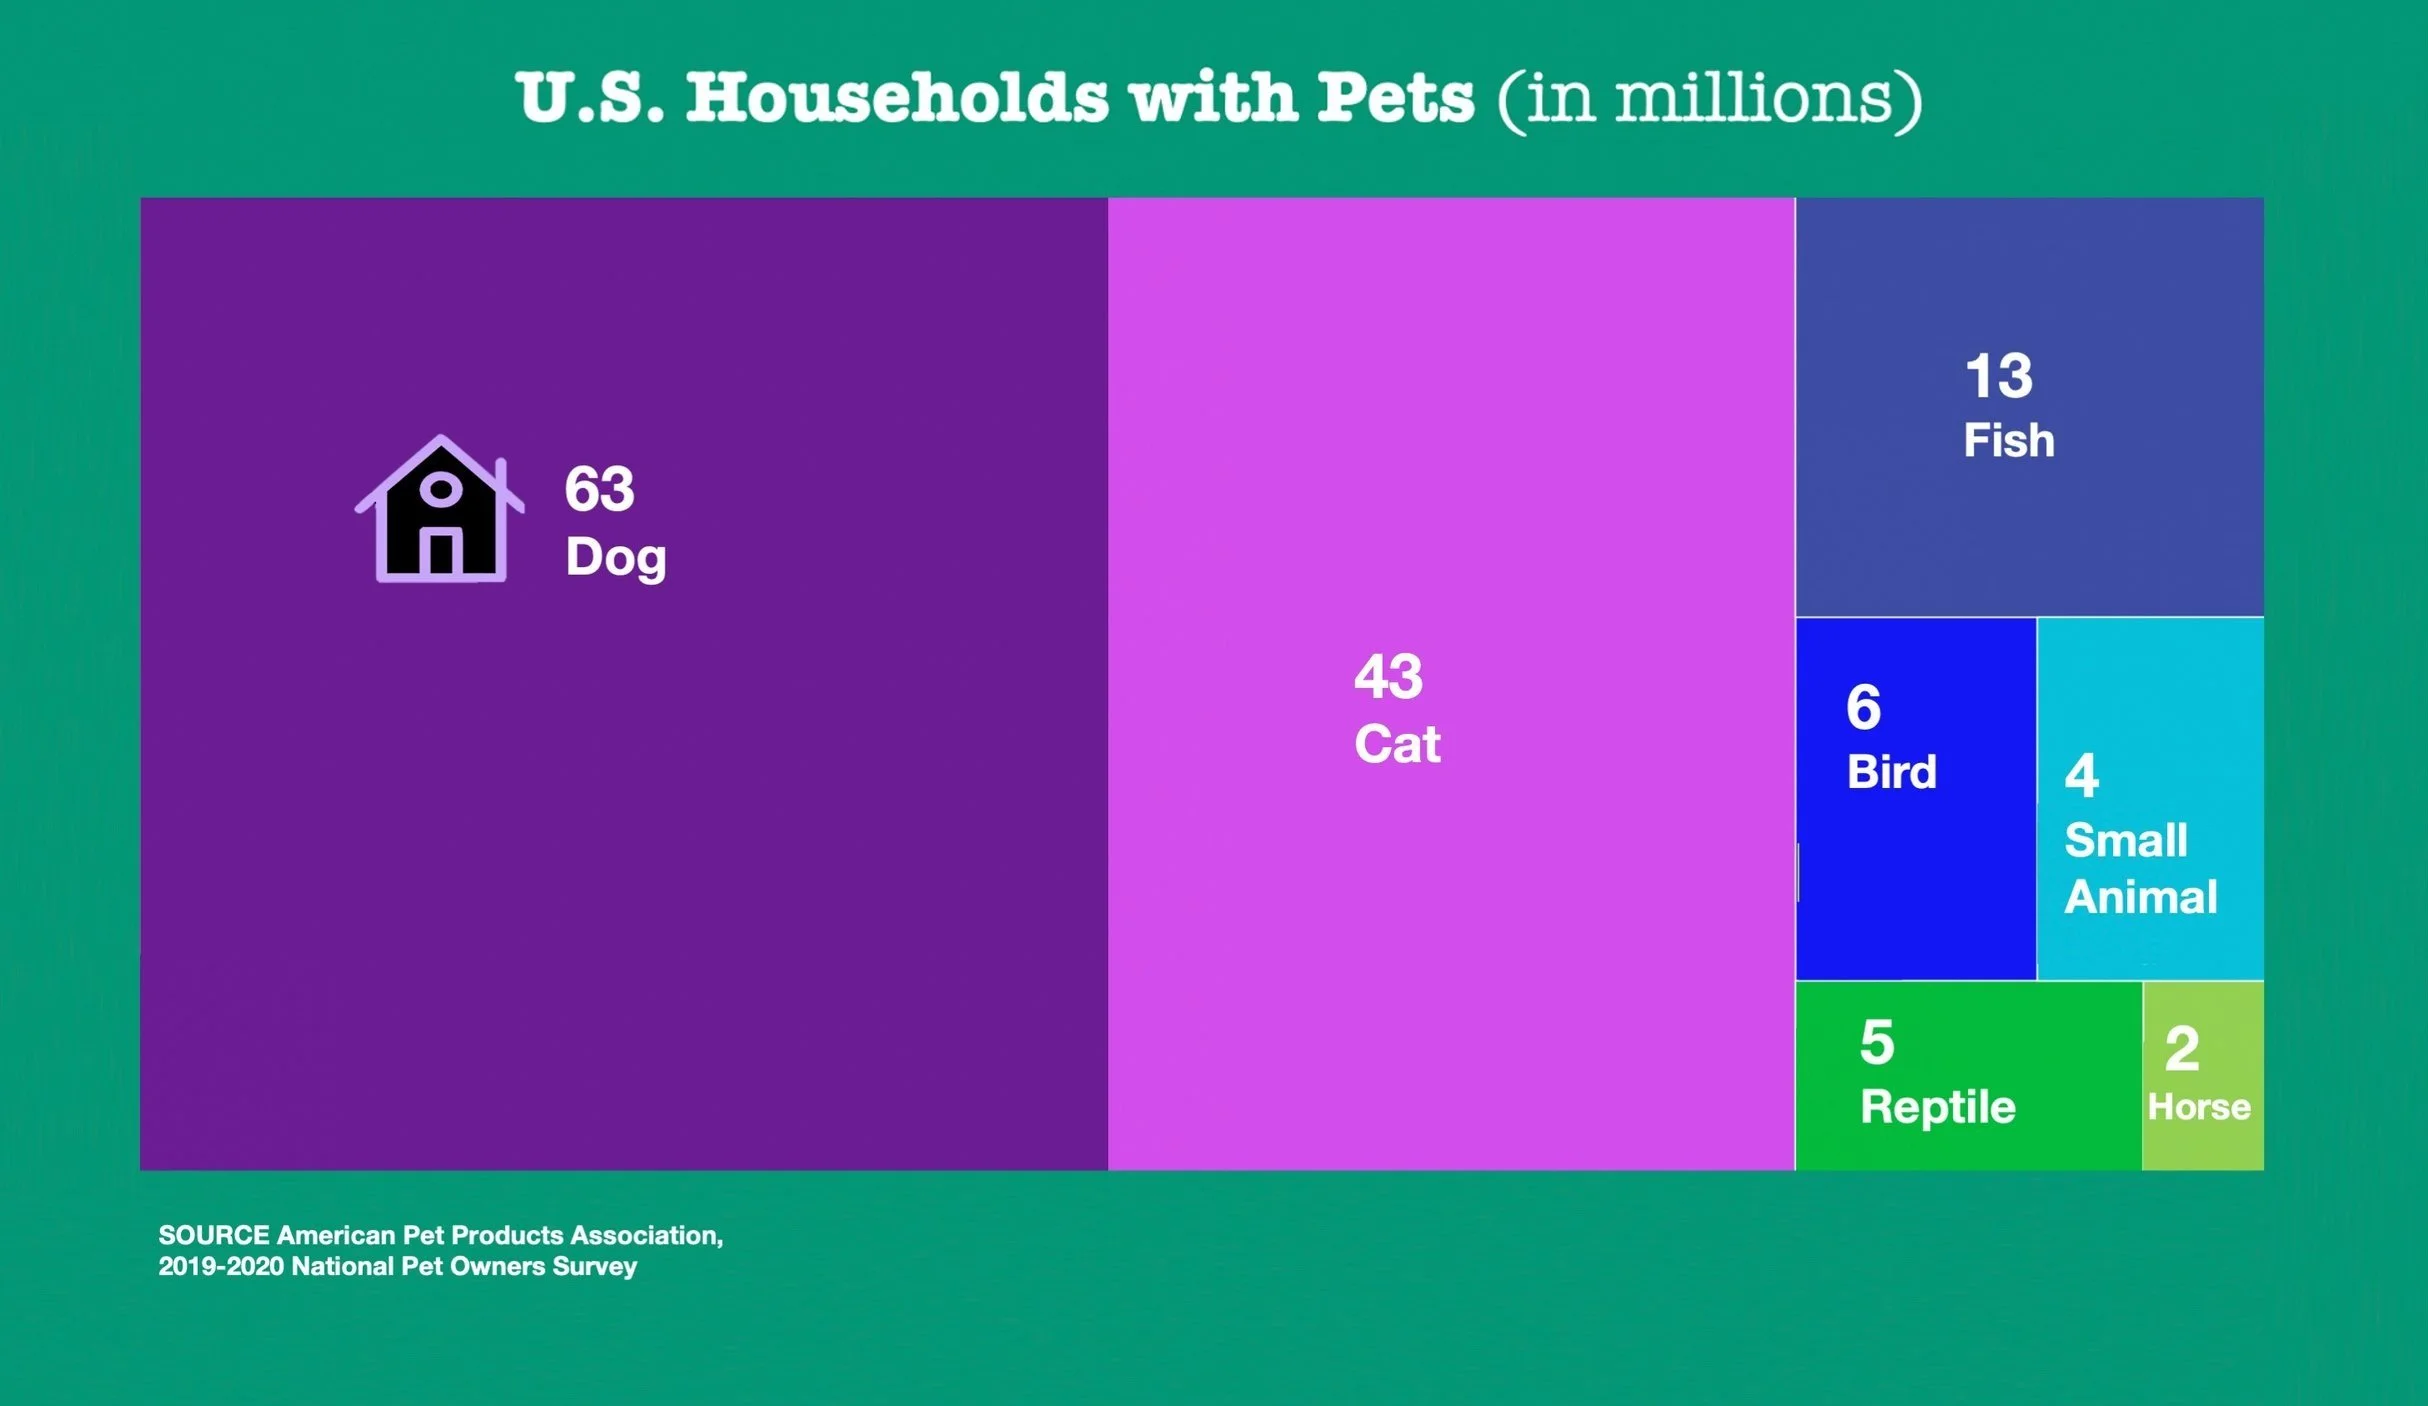
Do more U.S. households have a bird or fish? How can you tell?
A bird
B fish
Check your answer . . .
More households have fish because the section labeled fish is much bigger than the section labeled bird. Also, the labels tell you the data value, and 13 million is much more than 6 million.