What Is a
Line Graph?
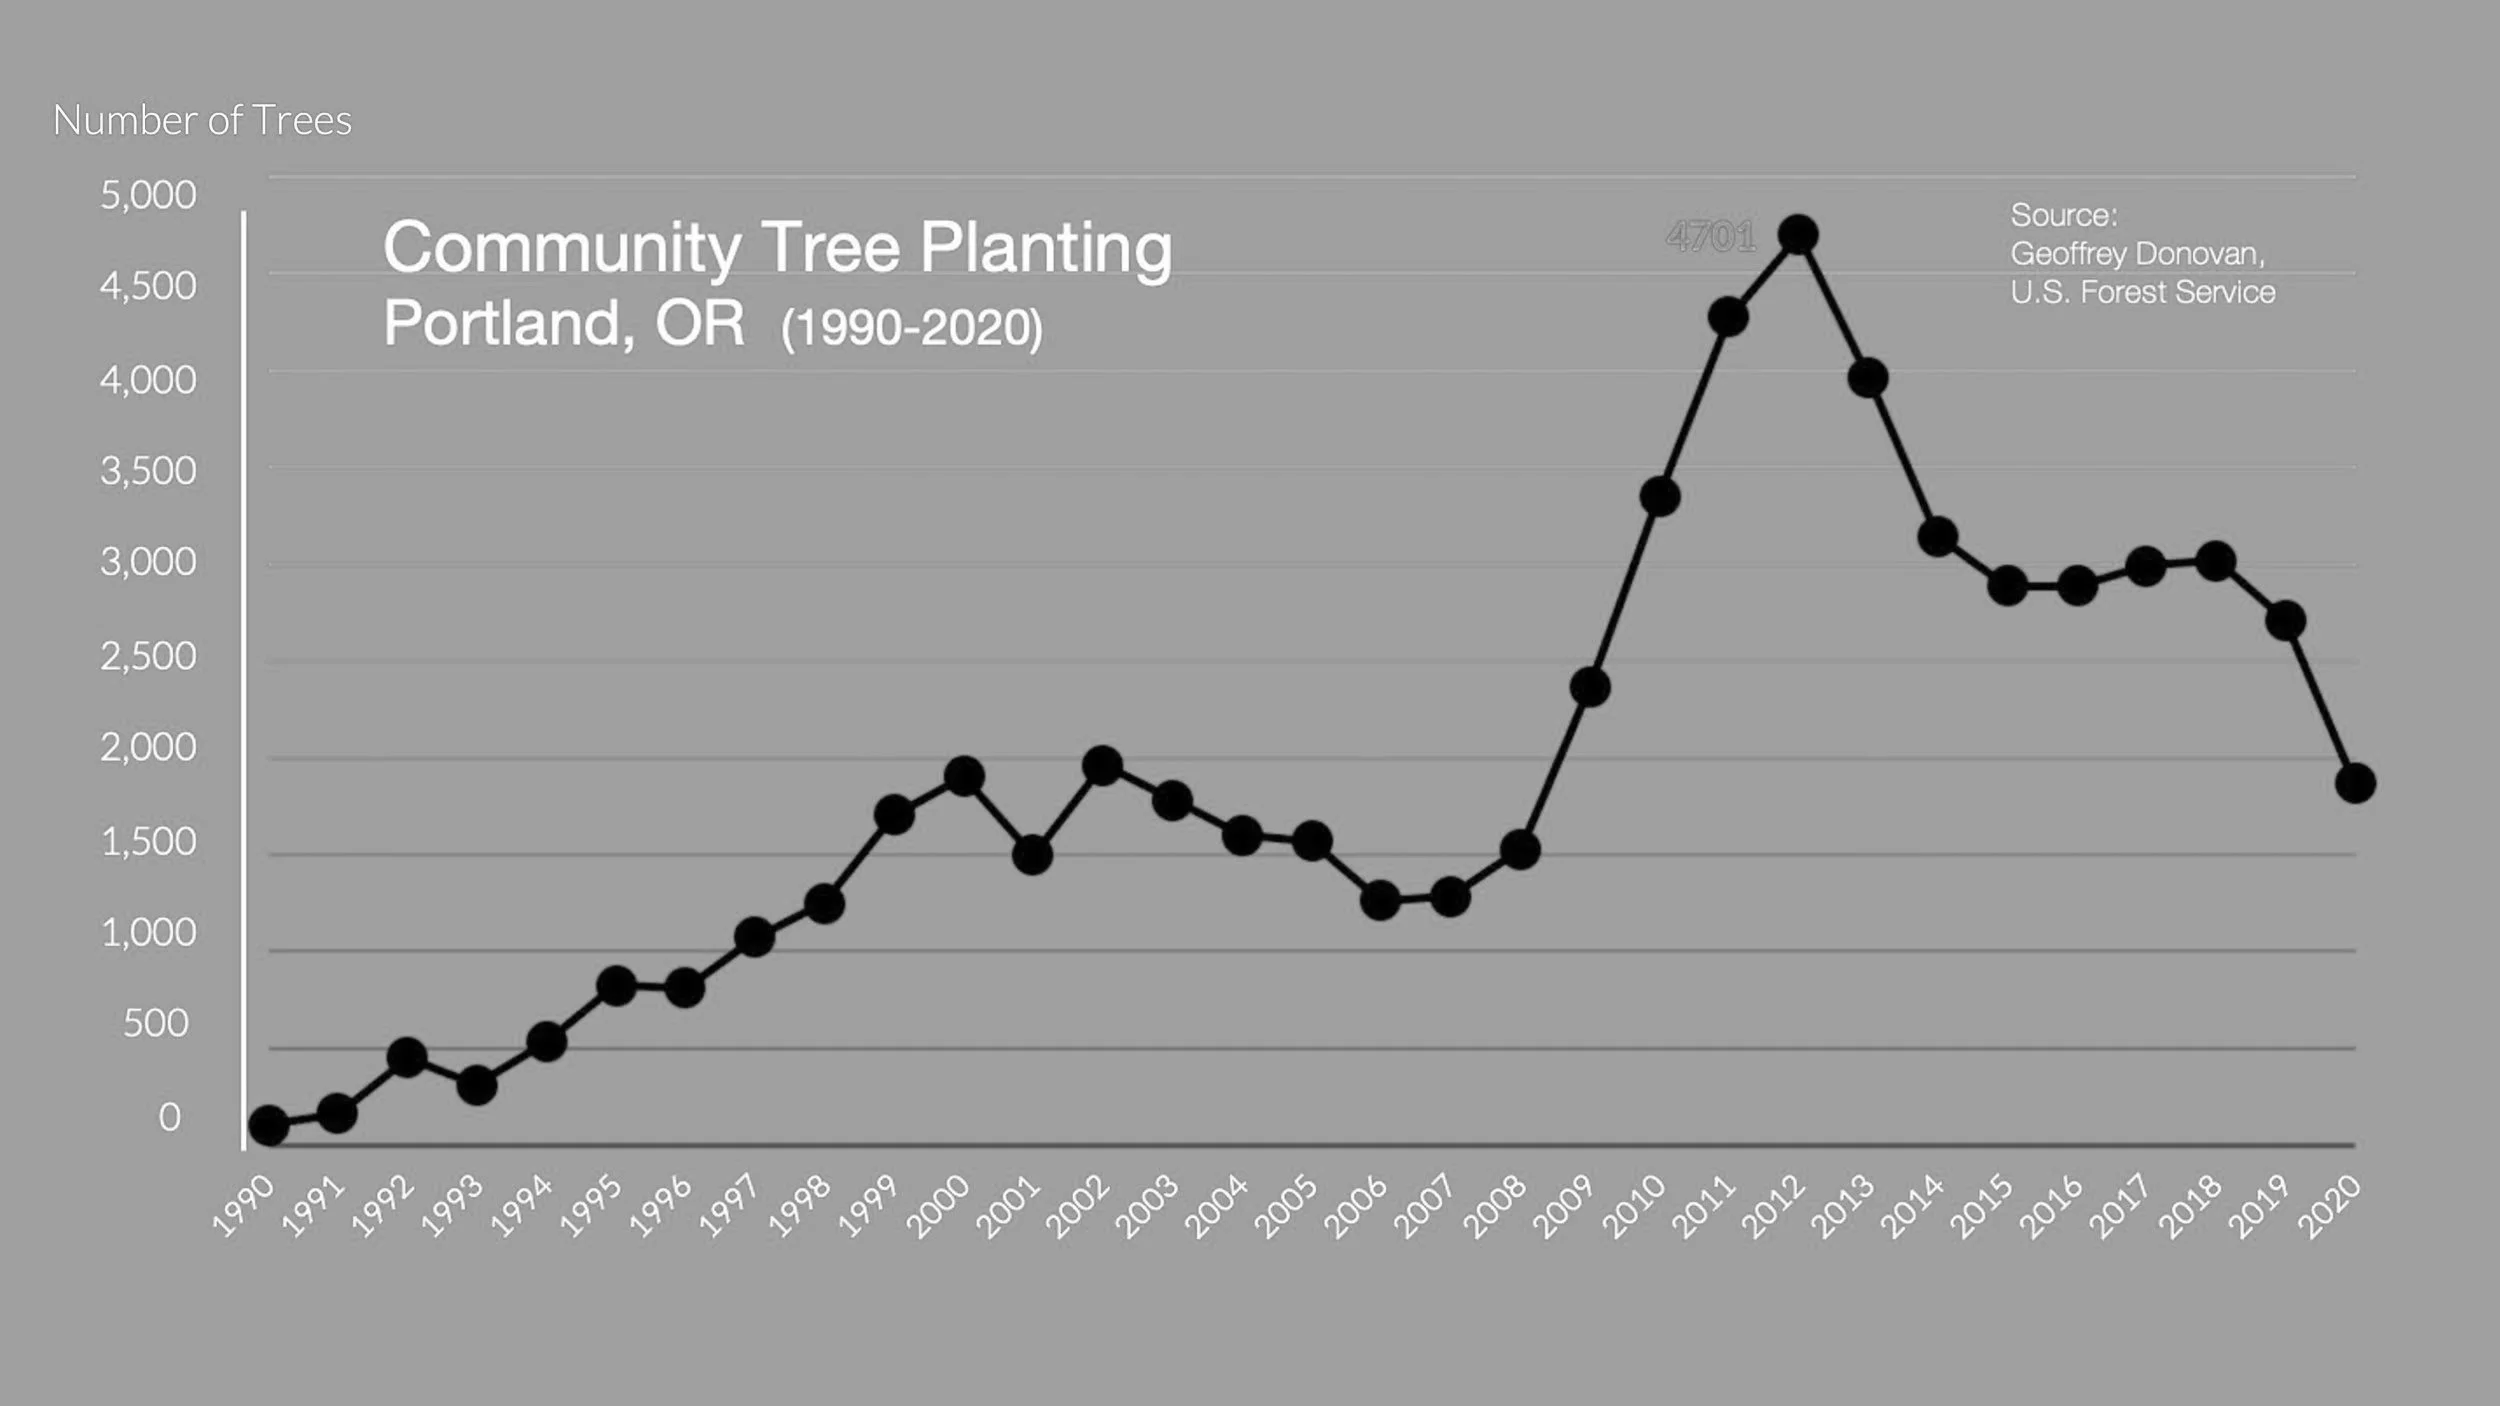
A line graph is a great way to see how things change over time.
It shows a set of data points connected with lines.
When you look at the lines you can see if values
are going up, going down, or staying pretty much
the same.
Be Viz Smart ✺

Why Viz?
Your brain processes pictures, colors, and shapes much faster than words and numbers.
This table shows the same data as the line graph, but it’s much harder to see a pattern or figure out what the data set means.