VIZOLOGY 101
Navigation Tips
Navigation Tips
LINE GRAPH
STEP 1
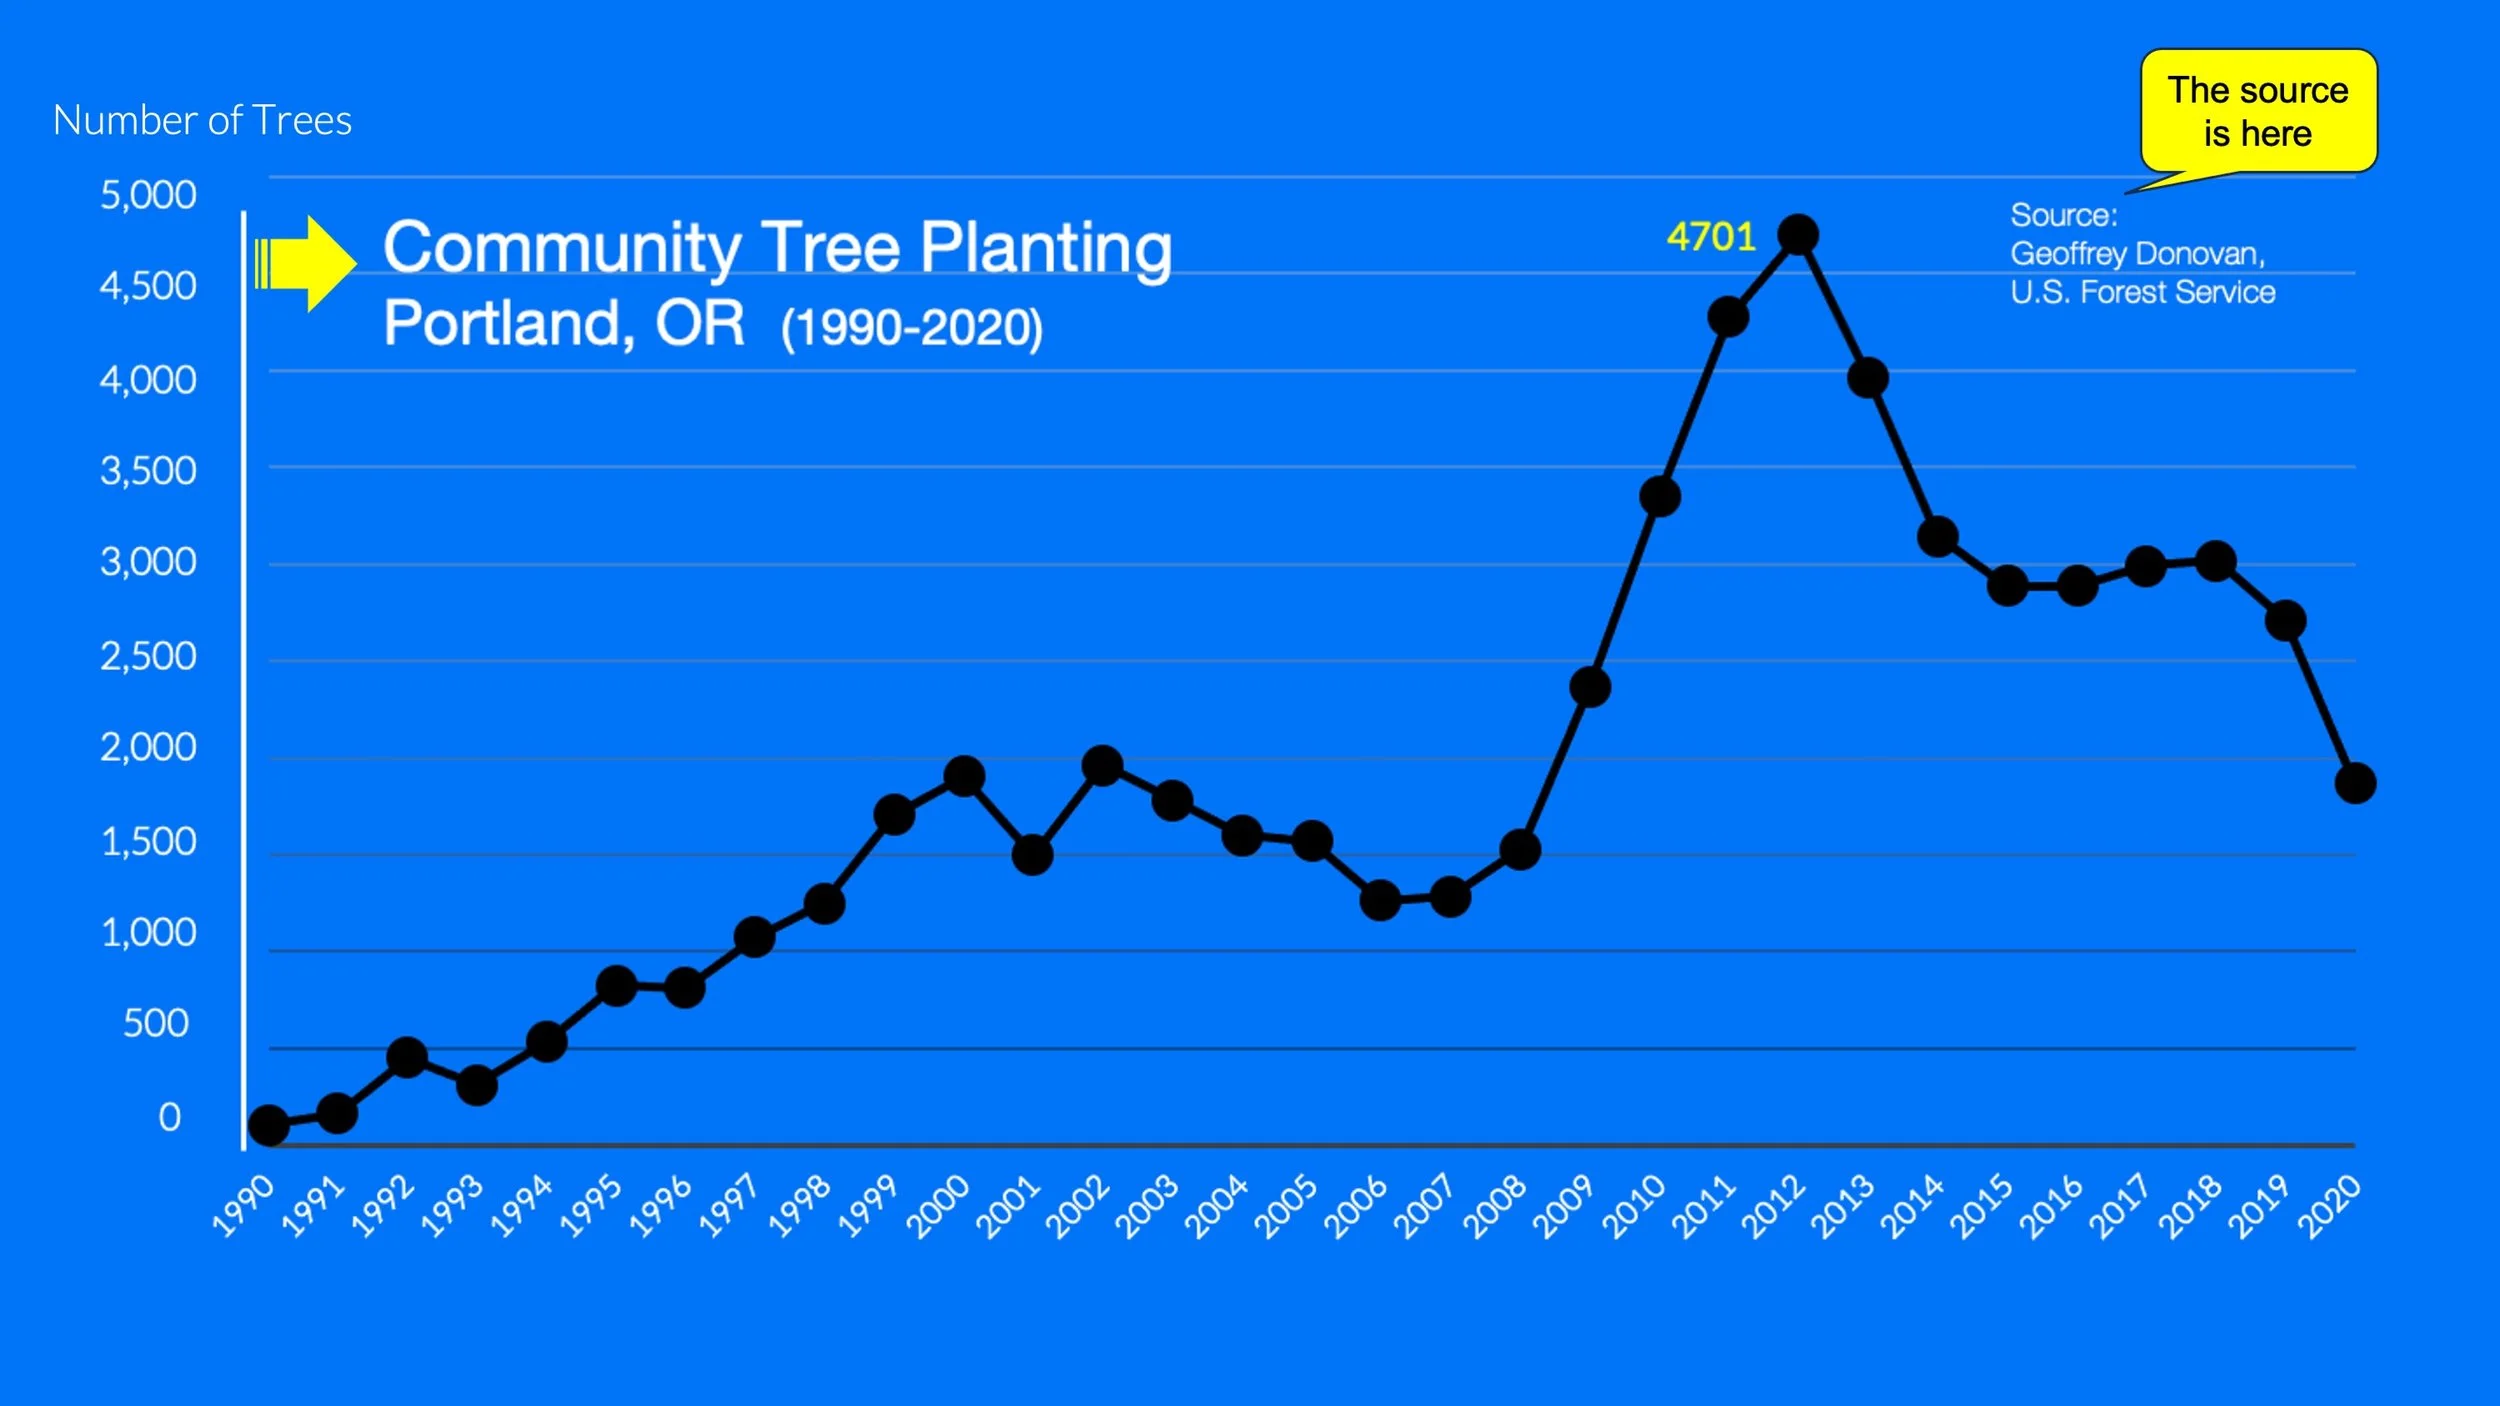
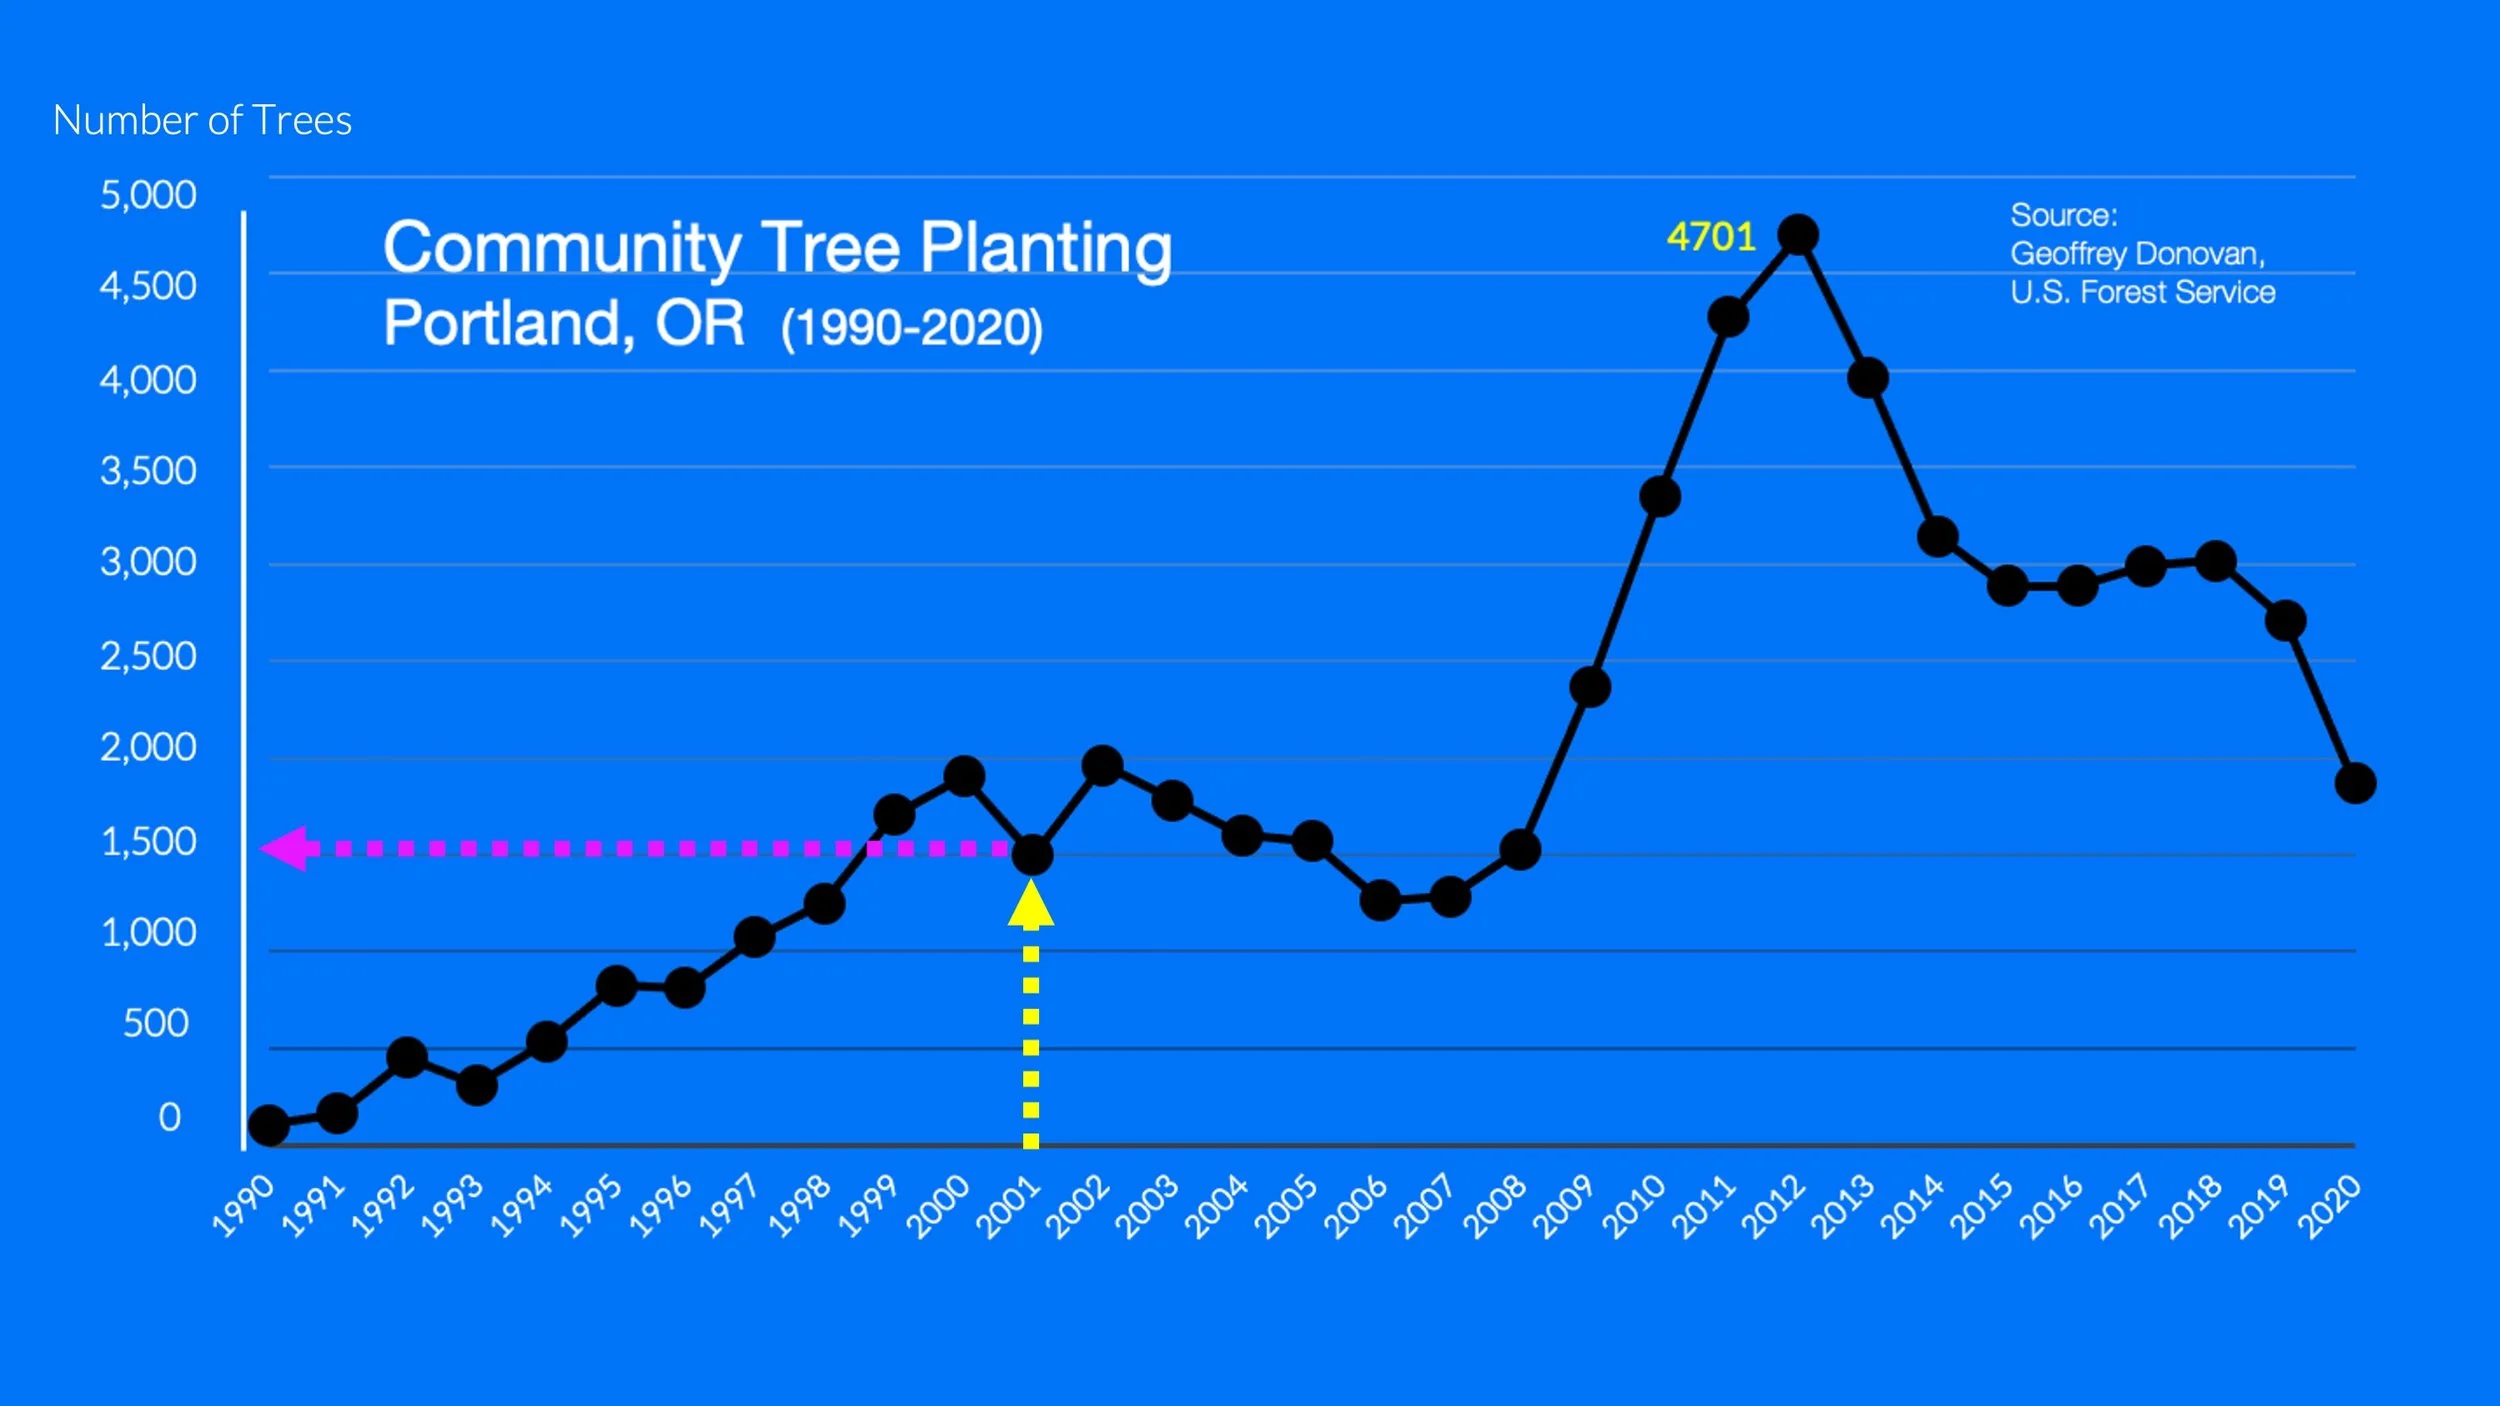
Read the title to get an idea of what the graph is about, and check the source to see where the data come from.
Is the U.S. Forest Service a good source of information on this topic?
A yes
B no
STEP 2
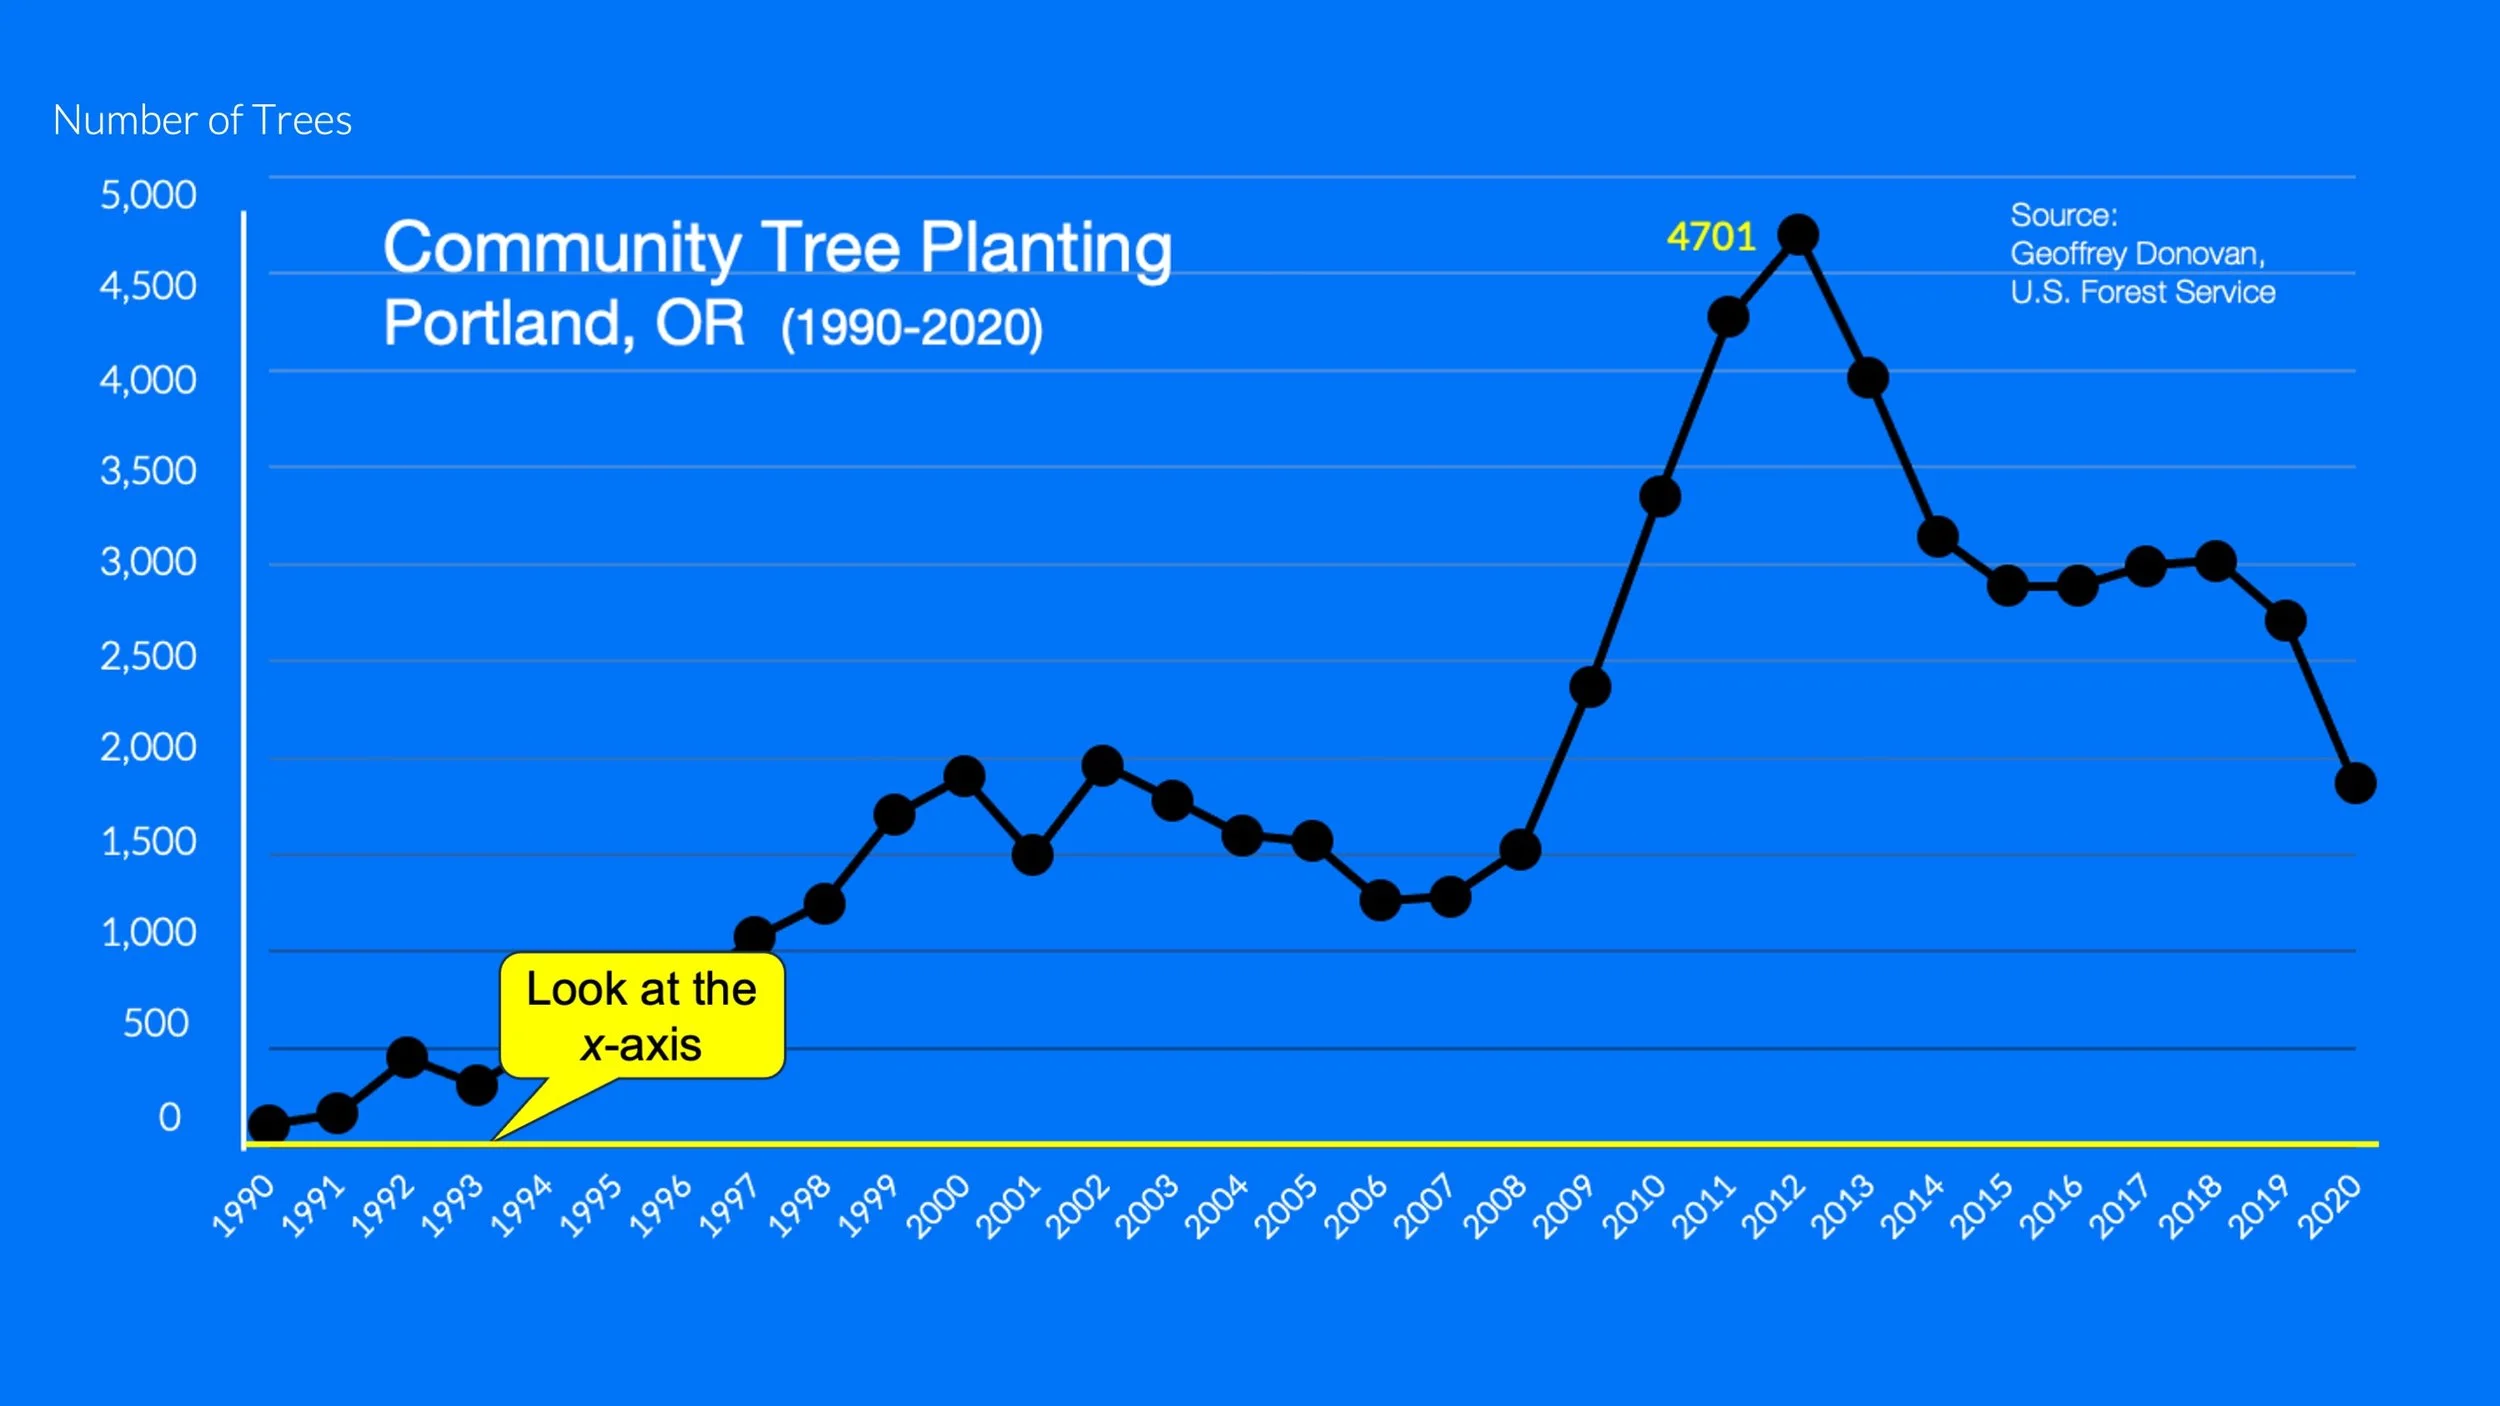
Look at the design, starting with the x-axis. That’s the line that runs from left to right at the bottom of the graph. It shows every year from 1990 to 2020.
Moving along this axis is like moving across time.
STEP 3
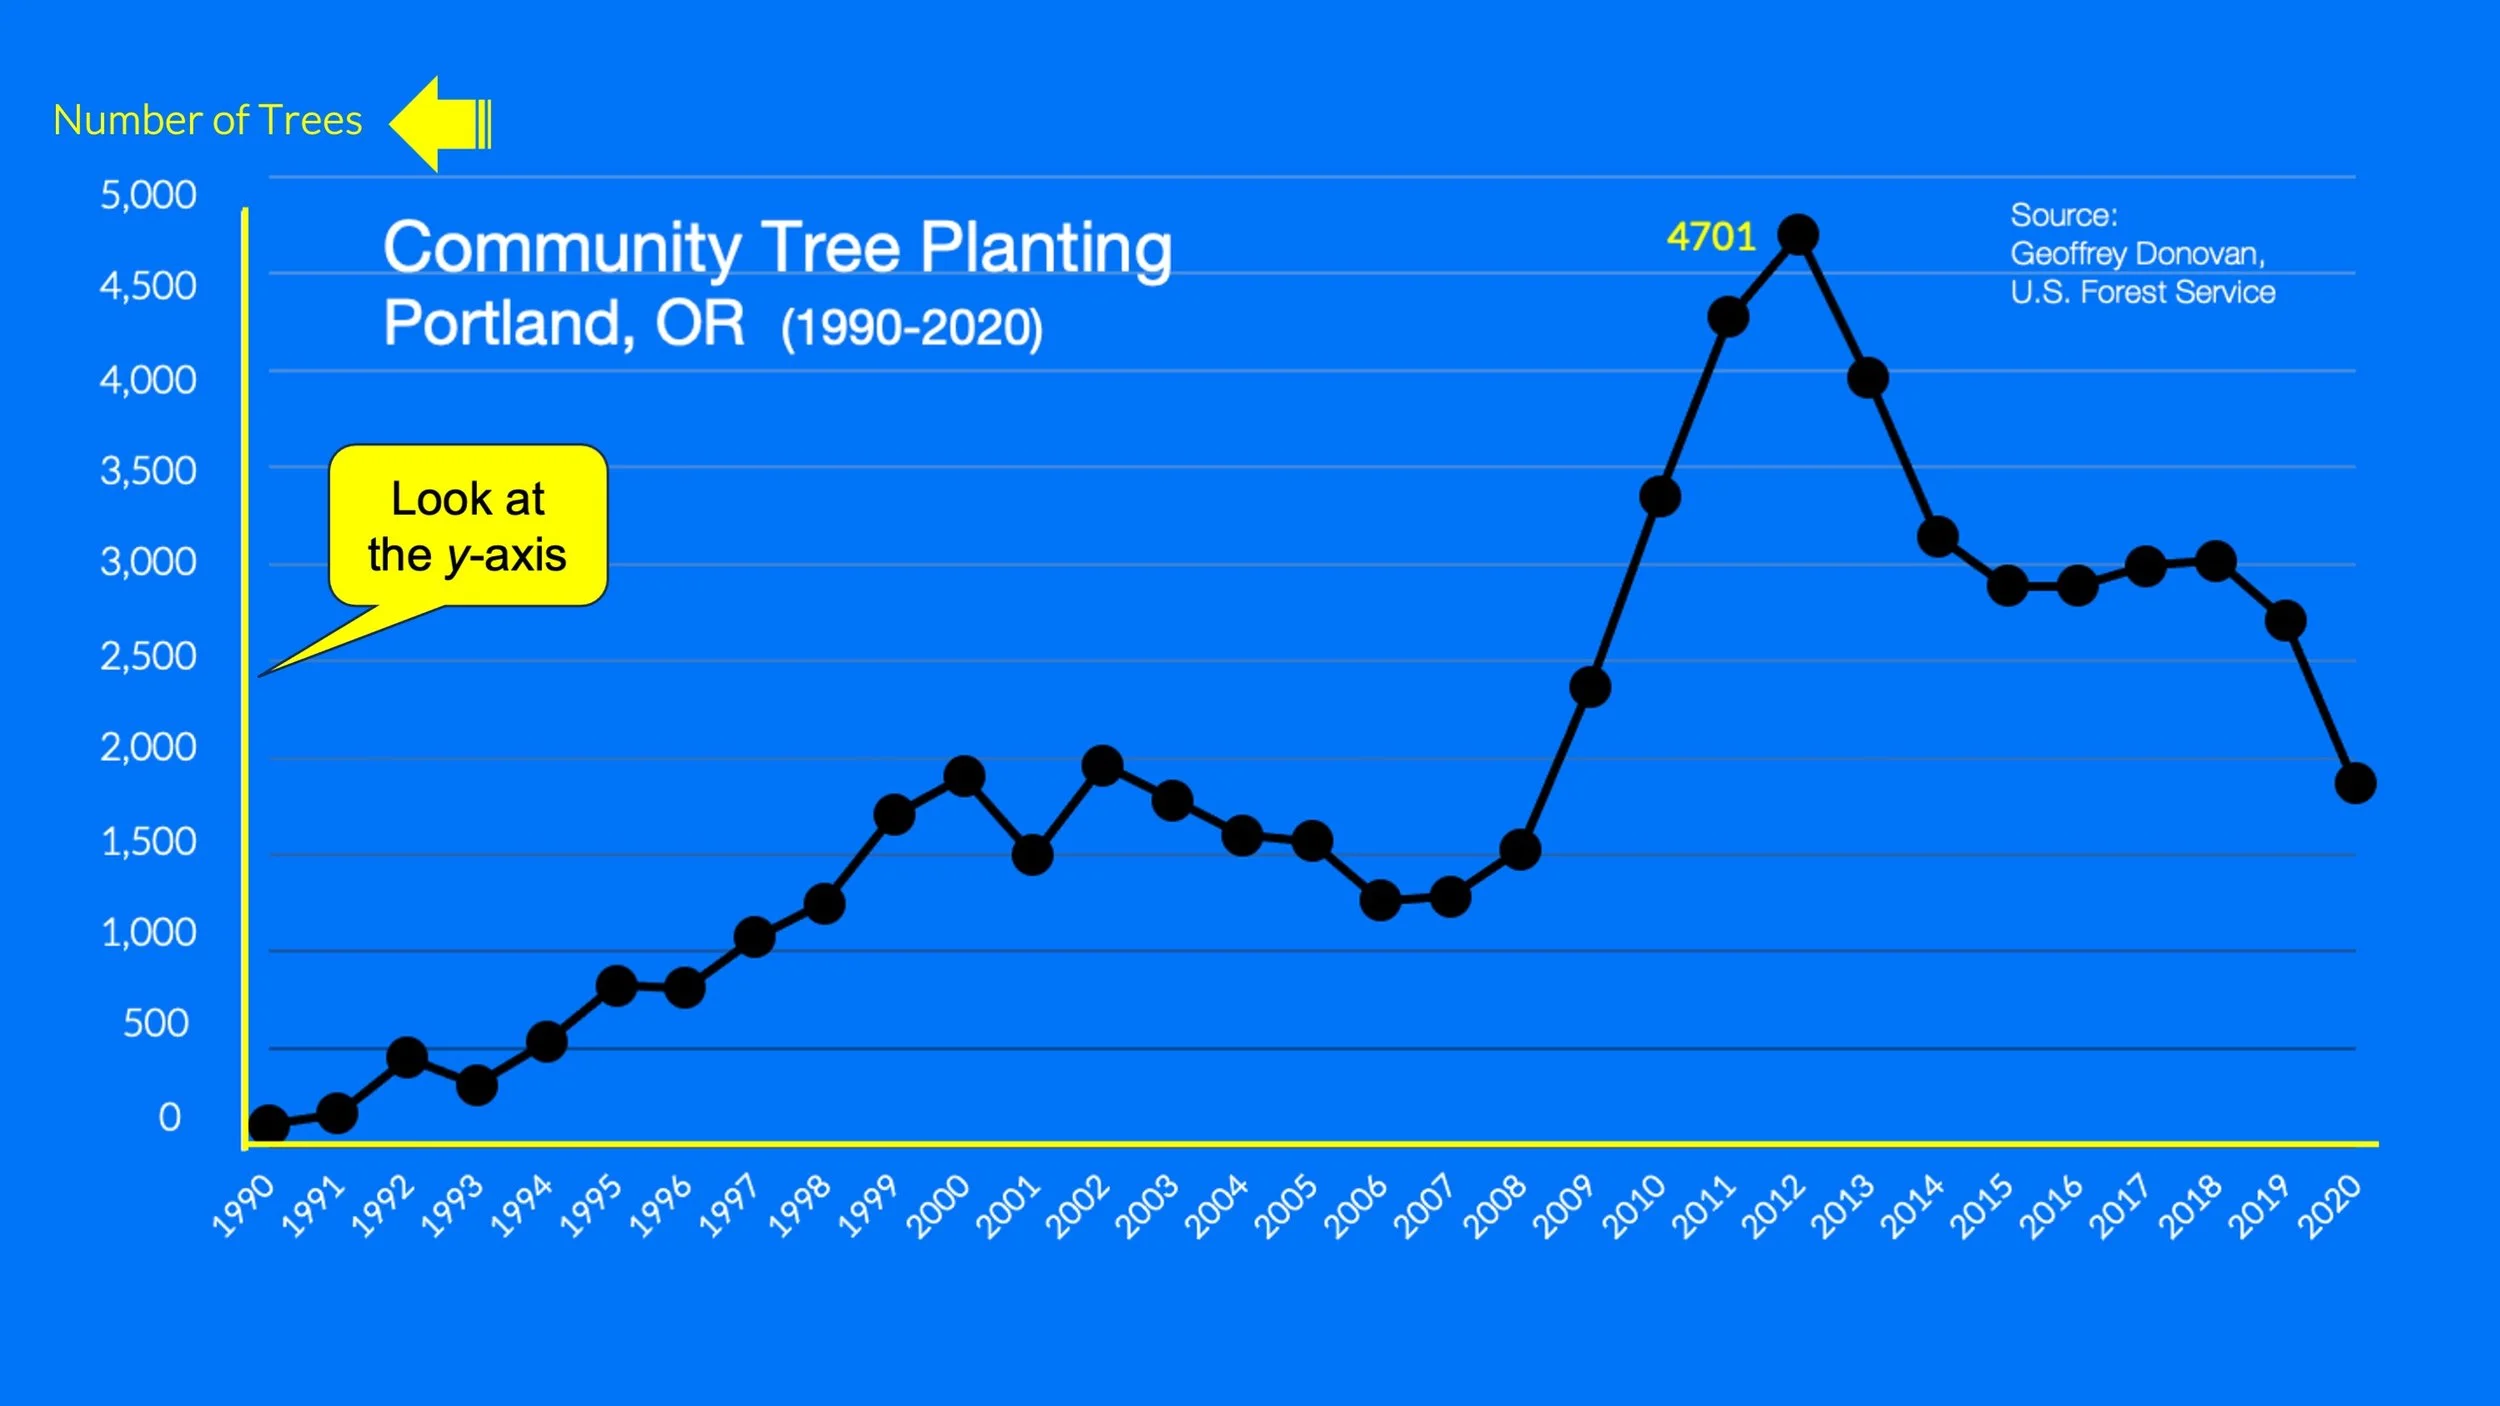
Look at the y-axis.
That’s the line that runs up and down the left side.
The label tells you the numbers represent the number of trees planted. The numbers start at zero trees and go up to 5,000, but not every number is shown.
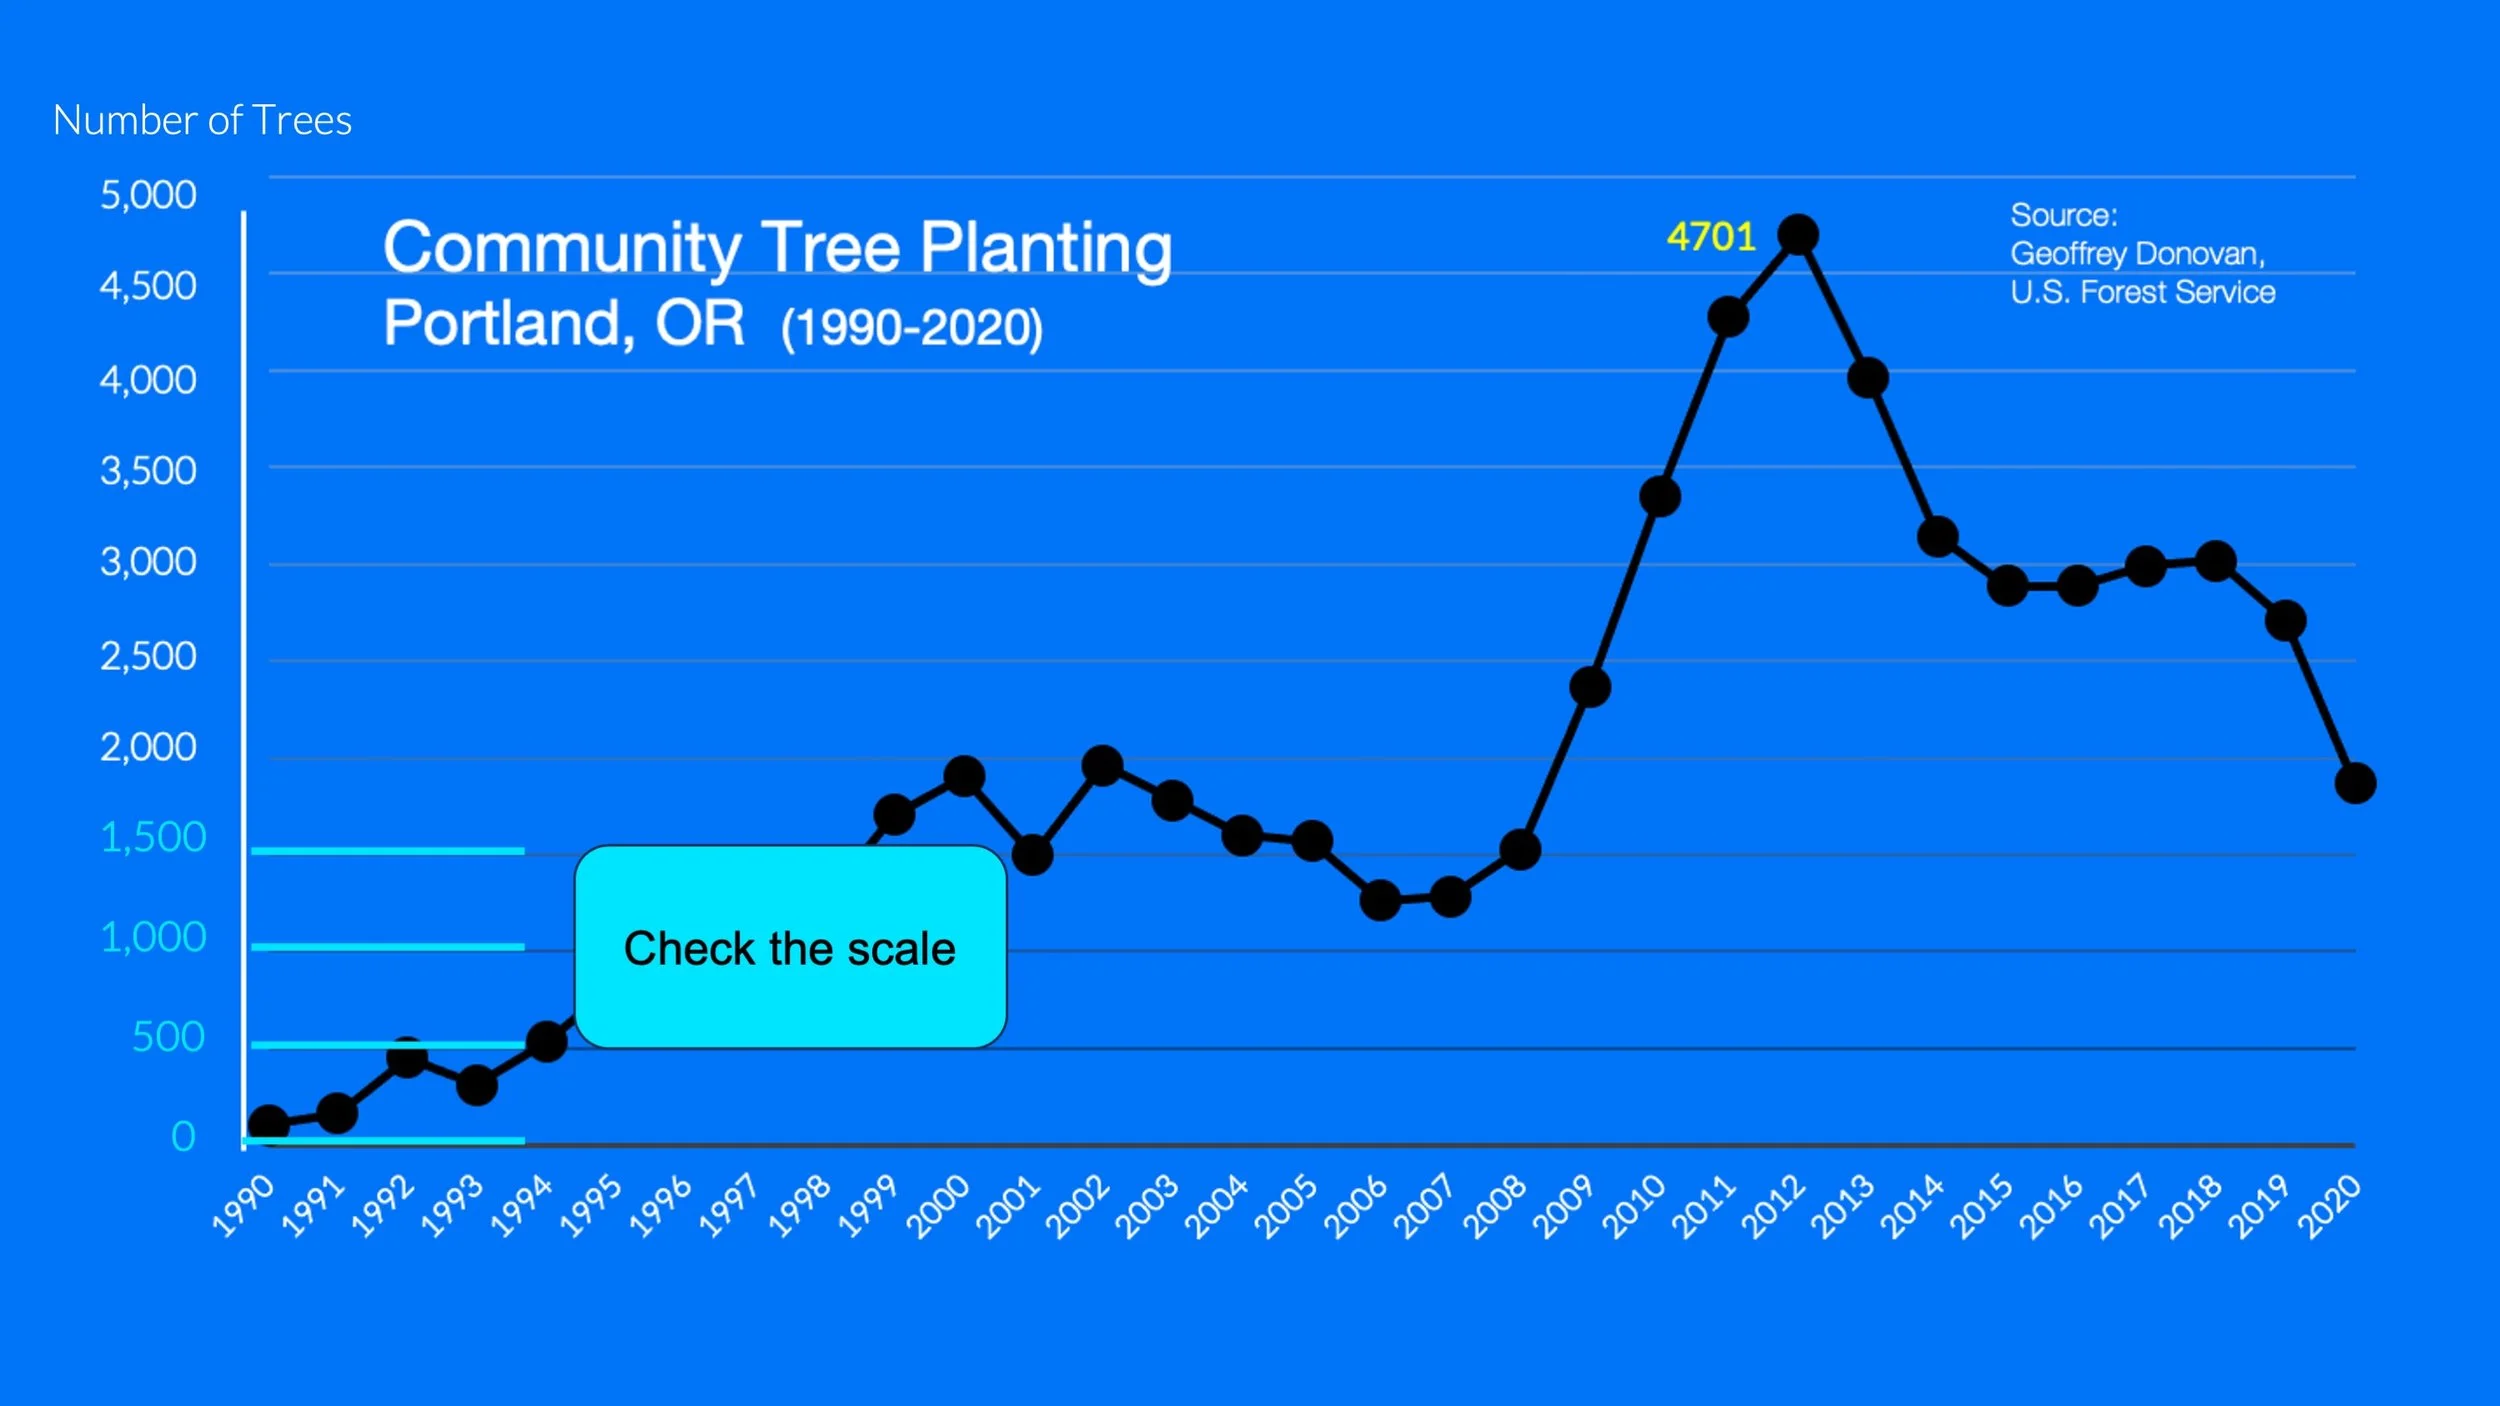
Check the scale. The numbers skip from 0 to 500, to 1,000 to 1,500, and so on. This means the graph is using a scale of 500. Each step up the y-axis equals 500 trees.
TAKE A CLOSER LOOK
How many trees did the volunteers plant in 2001?
A fewer than 1,500
B exactly 1,500
C more than 1,500
Check your answer . . .
Find the year 2001 on the x-axis, and imagine tracing a line to the data point directly above it.
Next, trace a line from the data point to the left until you intersect the y-axis. You wind up right at 1,500 on the scale.