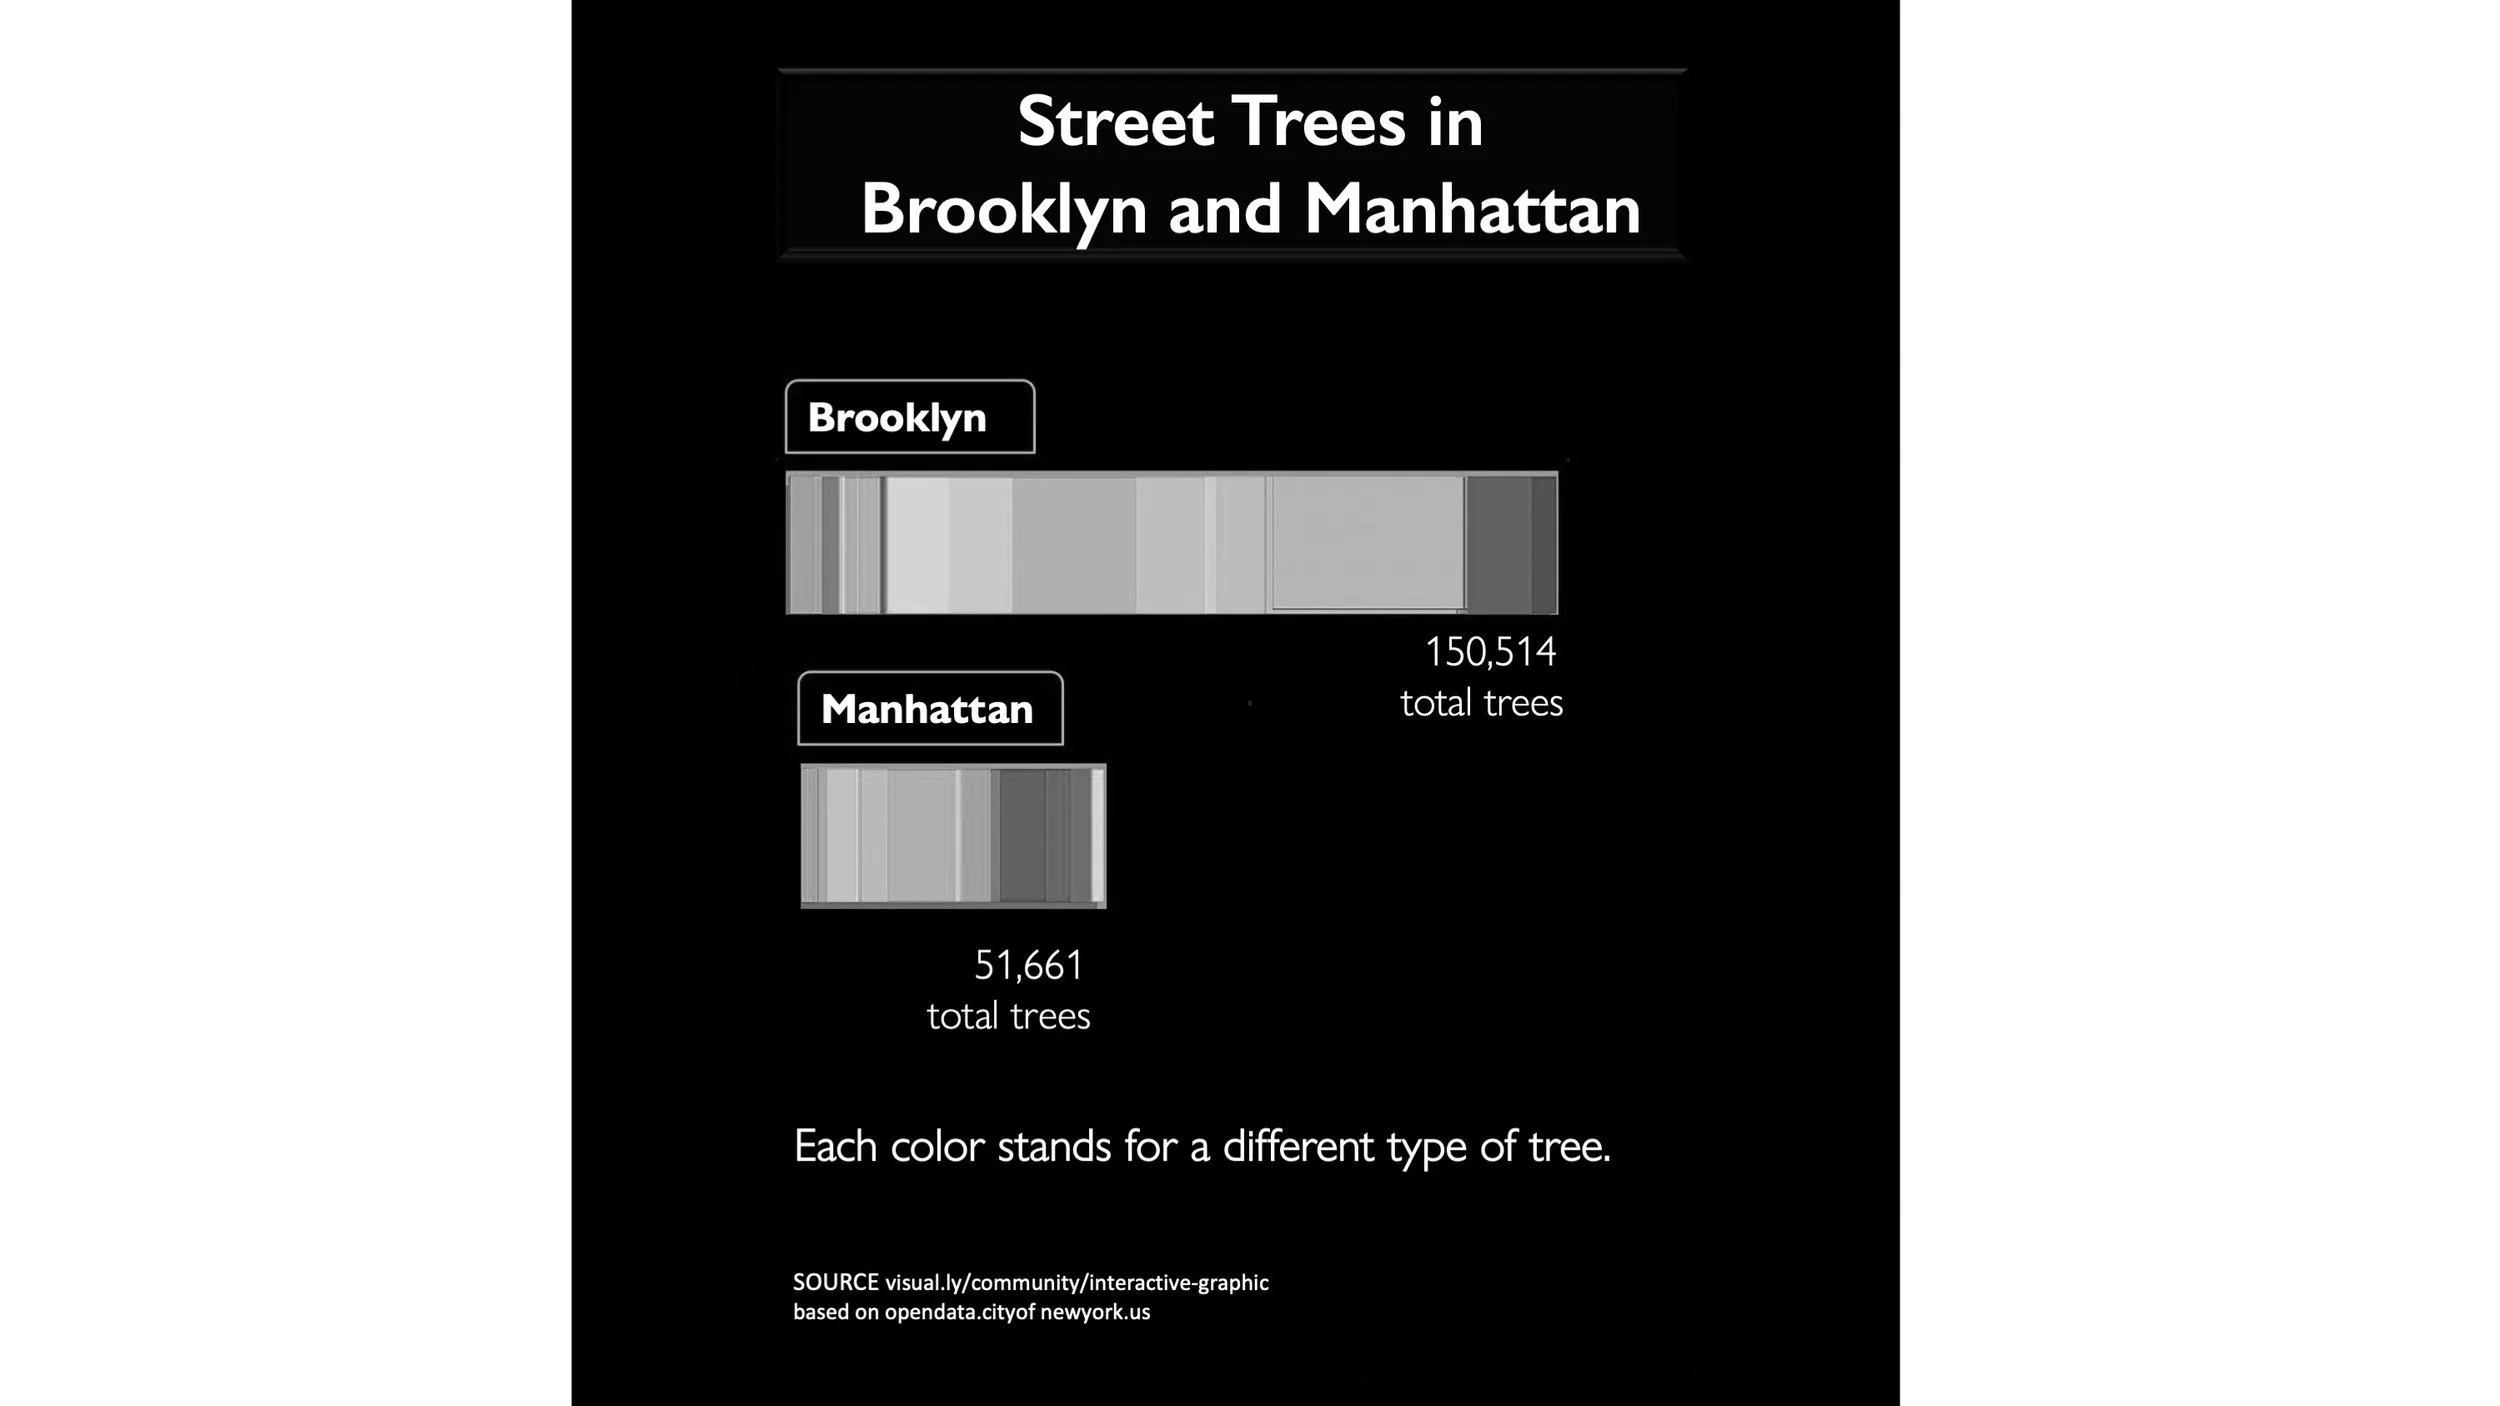
Listen What Is a Stacked Bar Graph? A stacked bar graph uses a segmented bar to show how a larger category is divided into smaller categories. The size of the segment reveals how big that category is compared to the total amount. CONTINUE>