Read the line graph and
answer the questions.
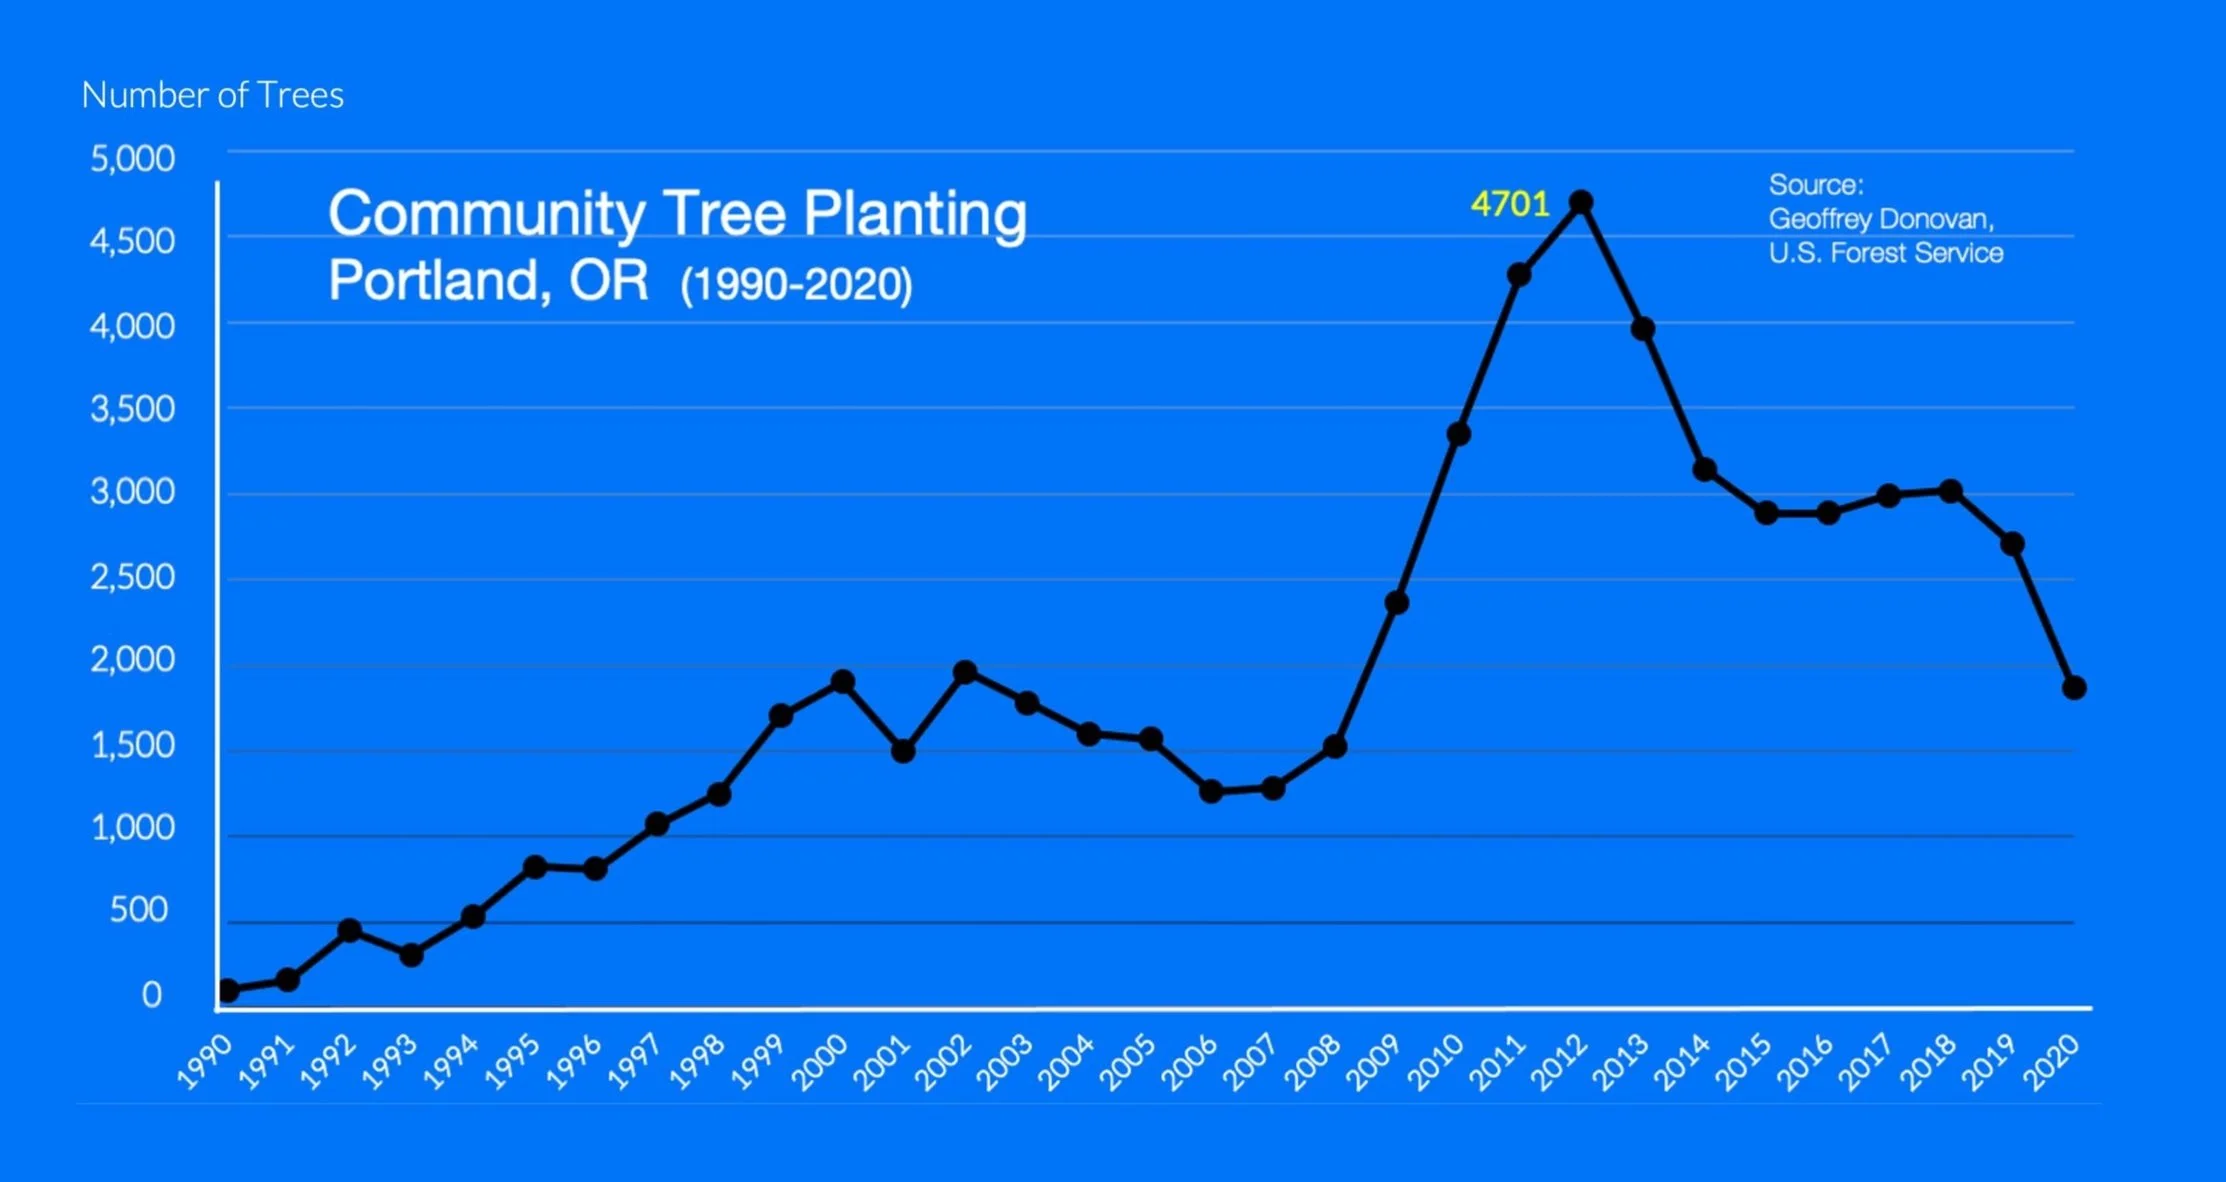
Q4 A. Across the years, the number increased more times than it went down so there was an upward trend reaching a maximum value in 2012.
Q5 A
Q6 Trees have many positive effects on cities, including reduced air pollution, lower summer temperatures, and more places to have fun and relax. Research has shown a relationship between urban trees and reduced crime, improved mental health, and even better grades in school!
4
How would you describe the trend, or overall direction of the data set across the years?
Hint: Count the number of times the value increased or decreased, from one year to the next.
A There was an upward trend that peaked in 2012
B Overall, the data stayed the same across the years
C Since 2010 there has been a downward trend
5
Could you use a bar graph like the one below to show this data set?
A yes
B no
C It depends

6
In 2023, researchers used these data to conduct a study. They found communities’ health had improved where trees were planted.
What are some ways cities in your state might benefit from volunteer tree planting projects?
[Enter your answer here.]

Insects and diseases target certain types of trees. Having a variety of street trees keeps things in balance.
Follow the flight plan to learn about the risks two big cities face!
NEXT LESSON PREVIEW