VIZOLOGY 101
Navigation Tips
Navigation Tips
STACKED BAR GRAPH

STEP 1
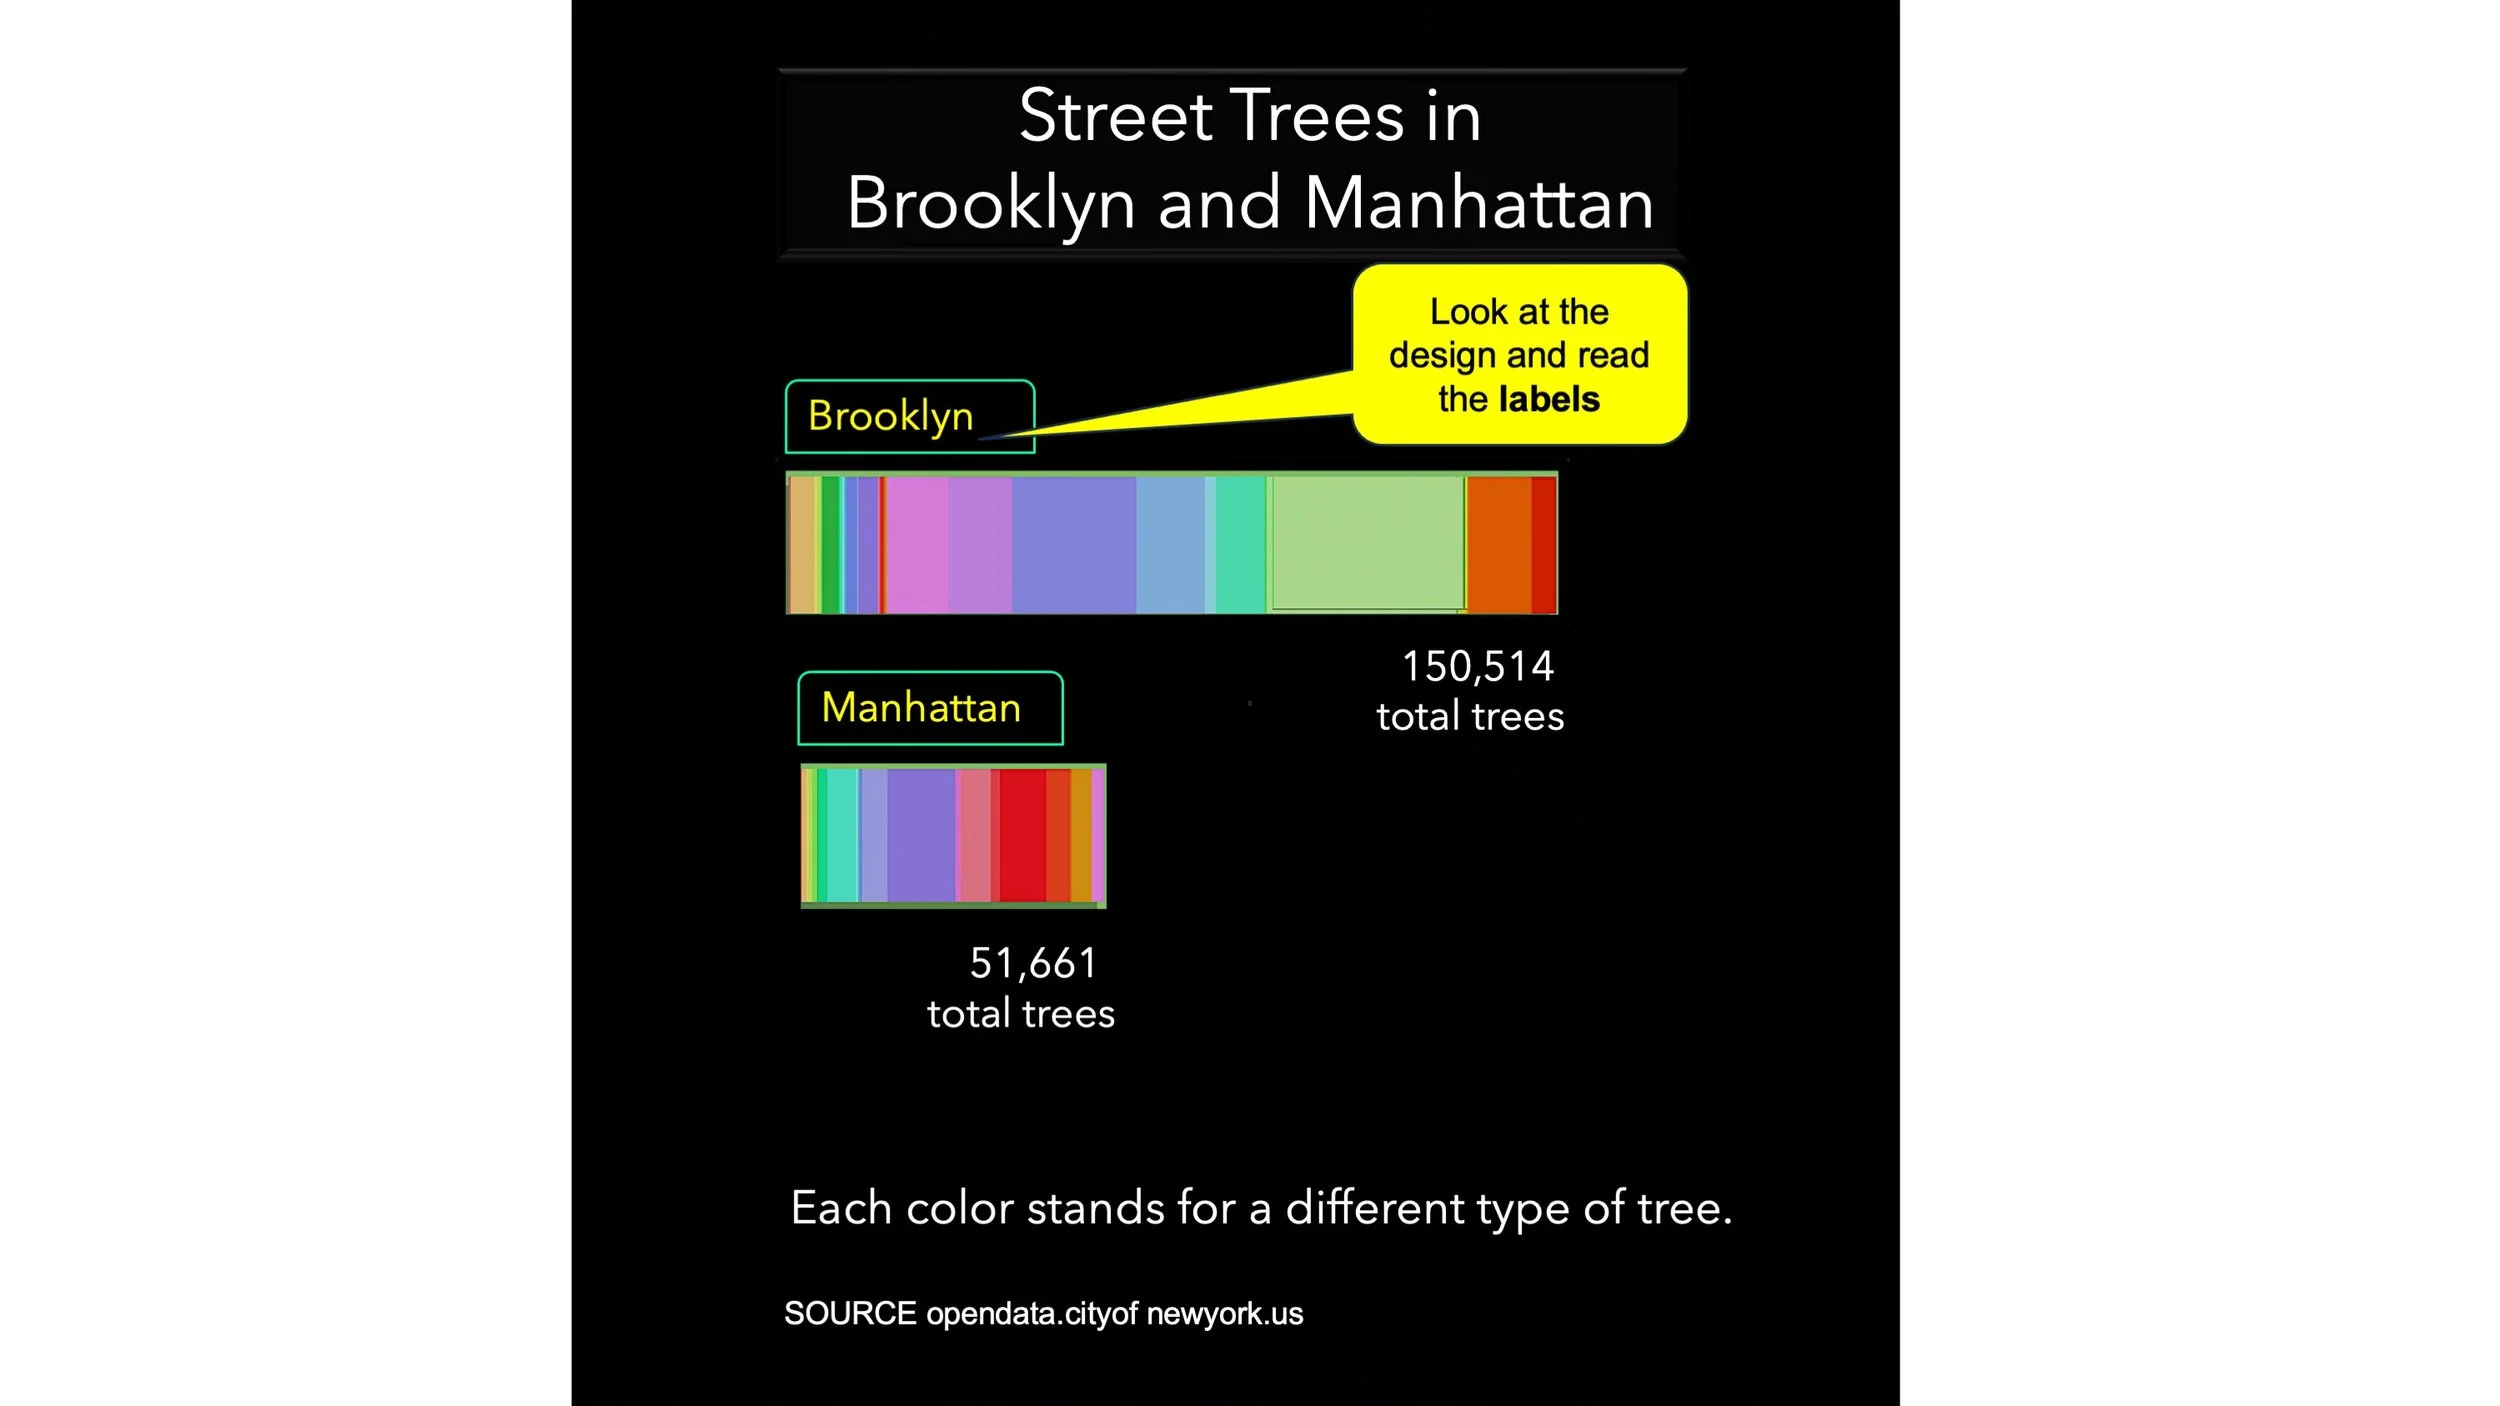
Read the title to discover what the graphs are about: “Street Trees in Brooklyn and Manhattan.” Those are two boroughs of New York City.
Now find the source. The website publishes free public data collected by New York City. In 2015, the city conducted a census to count every street tree growing in every part of the city. The raw data were downloaded from the website, analyzed, and then “visualized” into these stacked bar graphs.
STEP 2
Look at the design and read the labels. They tell you the first graph shows data for Brooklyn, and the second shows data for Manhattan.
The total length of the bar represents the total number of street trees counted in that place.

STEP 3
Find the number values: 150,514 and 51,661. The numbers tell you exactly how many street trees were growing in each place when New York City did the survey.

TAKE A CLOSER LOOK
Why are the bars divided into so many colors?
A to show how many types of trees there are
B to show how quickly the trees are growing
C to show where the trees were planted
Check your answer . . .
Find the note that explains the colors: “Each color stands for a different type of tree.”
Notice the two green segments in the first bar. Each shade of green stands for a type of tree, and the length of the color band stands for the number of that type. So when you see a long color band, that means one type of tree makes up a big part of all the trees counted in that place.
There is a lot of information packed into these graphs! They not only capture the total number of street trees in Brooklyn and Manhattan at a point in time. They show how the total number is divided into different types of trees.